

Cointime

Download App
iOS & Android

Solana (SOL) Price Drops 17% in a Week as It Struggles Below $200

Cointime Official

From beincrypto by Tiago Amaral

Solana (SOL) price has seen strong corrections over the past week, dropping 17% and falling below the $100 billion market cap. The Ichimoku Cloud chart indicates that bearish momentum remains dominant, with SOL trading below key trend indicators and reflecting downside pressure.

Meanwhile, the Directional Movement Index (DMI) suggests that the strength of the current downtrend is still intact, though selling pressure appears to be weakening. With technical indicators showing mixed signals, SOL’s next move will depend on whether it can regain momentum or continue its decline toward lower support levels.

SOL Ichimoku Cloud Show the Bearish Momentum Is Still Here

The Ichimoku Cloud chart for Solana shows a predominantly bearish setup. The price is trading below the cloud, and the cloud itself is shaded red, indicating continued downside pressure.

The Kijun-sen (red line) remains above the price, reinforcing the bearish bias, while the Tenkan-sen (blue line) is also positioned below the cloud, suggesting that short-term momentum is still weak.

Additionally, the Senkou Span A (green cloud boundary) is trending below Senkou Span B (red cloud boundary), signaling that the broader trend remains downward. The fact that the price is below both the conversion and base lines further confirms that bears are in control.
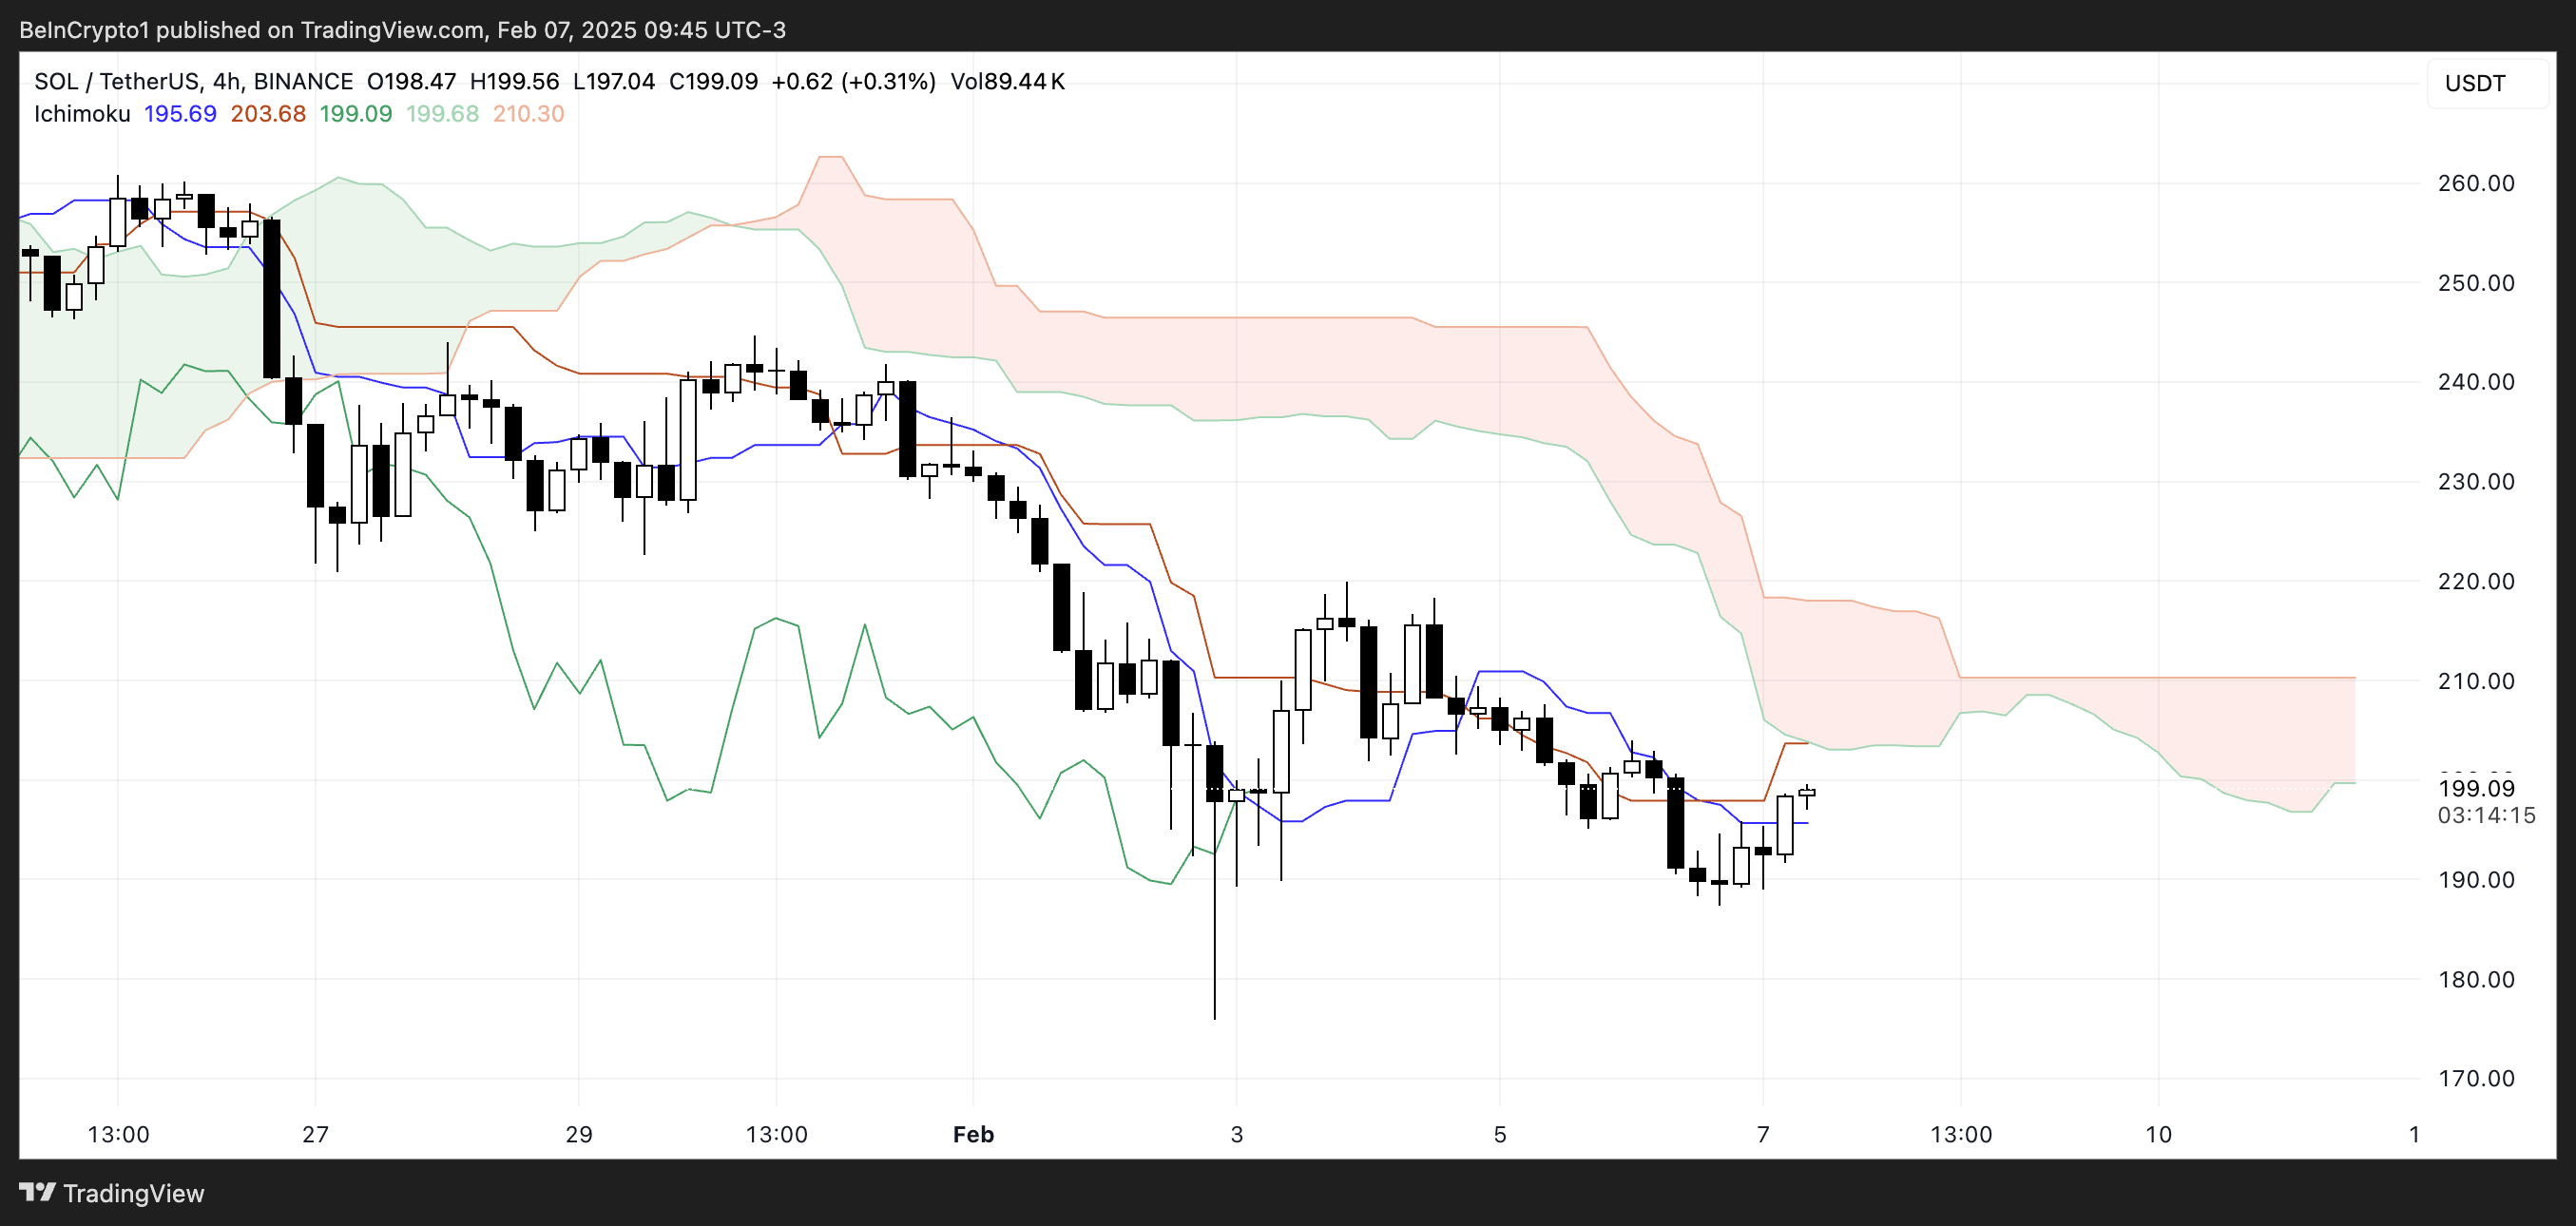
  SOL Ichimoku Cloud. Source: TradingView.  

However, there are signs of potential stabilization, as SOL has recently attempted to push higher and is testing the Tenkan-sen. If the price can sustain momentum above this level, it may indicate an early shift in sentiment.

The Lagging Span (green line) is still below the price action, meaning that no clear bullish confirmation is present yet.

To establish a trend reversal, SOL would need to break above the cloud, which remains a key resistance zone. Until then, the prevailing Ichimoku structure suggests that the market is still in a corrective phase, with the cloud acting as a dynamic barrier to further upside movement.

Solana DMI Shows the Downtrend Could Be Easing

Solana Directional Movement Index (DMI) chart indicates that the Average Directional Index (ADX) is currently at 33.3 and has remained between 30 and 35 for the past four days. The ADX measures trend strength, with values above 25 generally indicating a strong trend and values below 20 suggesting weak or range-bound price action.

A reading between 30 and 35, as seen in SOL’s case, confirms that the ongoing trend – whether bullish or bearish – is holding firm.

However, the direction of the trend is determined by the movement of the +DI and -DI lines, which represent buying and selling pressure, respectively.

  SOL DMI. Source: TradingView.  

Currently, Solana +DI stands at 15.2 and has been stable around this level for the last three days, suggesting weak bullish momentum.

Meanwhile, -DI has dropped to 24.2 after being as high as 32.6 just a day ago, indicating that selling pressure is easing. While SOL remains in a downtrend, the declining -DI suggests that bearish momentum may be weakening.

If the +DI starts rising while -DI continues to drop, it could signal a potential trend reversal. However, as long as the ADX stays elevated and the -DI remains above the +DI, the downtrend remains dominant. SOL could still face further downside pressure before any meaningful recovery occurs.

SOL Price Prediction: Will Solana Break Above $220 Soon?

In recent days, Solana price has been hovering near the $200 level, consolidating within a tight range as market participants assess its next move.

If bullish momentum returns, SOL could test the $211 resistance level in the near term. A successful breakout above this zone could open the door for further gains, with $223 as the next key target.

Should buying pressure strengthen, SOL price could even rally toward $244, marking a potential 22% upside from current levels. However, for this scenario to play out, Solana needs sustained demand and a shift in momentum to overcome the recent bearish trend.

SOL Price Analysis. Source: TradingView.  

On the downside, if the current downtrend persists and selling pressure intensifies, SOL could soon retest the $191 support level.

A breakdown below this critical level may accelerate losses, potentially sending the price toward $181 or even as low as $168, representing a 15% further correction.


Comments

All Comments

Recommended for you

  • Amazon Shares Surge 15.2%, Biggest Gain Since 2012

    On July 31, Amazon shares surged 15.2% to $271.255 per share, marking their biggest gain since 2012, with a total market value of $2.92 trillion.

  • US Treasury Secretary Bessent Vows to Track Down Iranian Assets Globally for Terror Victims

    US Treasury Secretary Bessent said the US will actively track down Iranian assets worldwide to ensure compensation funds for victims of Iran-backed terrorist activities. Bessent stated that the US government's military and economic blockade measures against the Iranian regime will continue and will not be relaxed. (Jinshi)

  • Apple Plunges Nearly 10%, Q4 Revenue Guidance Misses Expectations

    On July 31, Apple (AAPL.US) plunged nearly 10% to $300.33, marking its biggest drop since April 2025. In terms of fundamentals, Apple's third-fiscal-quarter revenue rose approximately 16% year-over-year to $109.42 billion, slightly above analyst expectations. Among the details, product revenue came in at $78.68 billion, beating the expected $77.25 billion. However, services revenue—a key driver of its valuation re-rating in recent years—totaled $30.74 billion, missing the consensus estimate of $31.36 billion. Additionally, Greater China revenue reached $18.82 billion, with year-over-year growth slowing to 22%, also below analysts' forecast of $19.58 billion. During the earnings call, Apple guided fourth-fiscal-quarter revenue growth in the range of 9% to 11%, overall below the 12.1% analysts had expected. CFO Parekh noted that component supply constraints would impact iPhone, Mac, and iPad businesses in the fourth fiscal quarter, with currency fluctuations also constraining growth.

  • Three Fed Officials Back Rate Hike, Hawkish Pressure Builds

    On July 31, three Federal Reserve policymakers said that dissenting votes in favor of a rate hike this week stemmed from stubborn inflationary pressures, highlighting rising internal pressure on Fed Chair Warsh to act. In statements released Friday morning, Hammack and Kashkari said they worry that although the current round of price increases may stem from short-term factors such as President Trump's tariff policies and the Iran war, the inflation situation already warrants Fed action. Logan also joined in, saying that even if inflation cools, if the Fed does not raise rates, inflation is unlikely to fully fall back to the Fed's 2% target; without any policy constraints, inflation could continue to run above target until an unexpected shock occurs. Kashkari said that if inflation remains persistently stubborn, he might support a series of rate hikes, not just a single increase, to prevent inflation from becoming further entrenched. He said: "A series of small policy adjustments may be preferable to waiting for developments to unfold and ultimately having to take more forceful action." Hammack said that if the Fed does not tighten policy, price increases could continue to accelerate. She said: "Inflation has been stubbornly above 2% for more than five years, and I have no confidence that it will return to our target on its own." (Jin Shi)

  • US 10-Year Treasury Yield Rises to 4.7388%, Highest Since January 2025

    On July 31, the US 10-year Treasury yield rose to 4.7388%, the highest level since January 2025.

  • Spot Gold Intraday Decline Widens to 2%, at $4,021.08 per Ounce

    On July 31, spot gold's intraday decline widened to 2%, reported at $4,021.08 per ounce.

  • BTC Falls Below $63,000

    Market数据显示,BTC has fallen below $63,000, currently reported at $62,985.99, with a 24-hour decline of 2.99%. Market volatility is significant, please exercise risk control.

  • Fed's Logan: Leaning Toward 25 Basis Point Rate Hike

    On July 31, Federal Reserve Governor Logan said she leans toward a 25 basis point rate hike, believing inflation has not yet entered a sustainable path back to the Fed's 2% target. Logan stated that taking moderate action now would reduce the risk of needing more aggressive tightening in the future, while emphasizing that the Fed cannot rely on unexpected shocks to achieve its inflation target.

  • Fed's Logan: Taking Modest Actions Now Reduces Likelihood of Needing Stronger Action Later

    On July 31, Dallas Fed President Lorie Logan said that taking modest actions in the near term would reduce the likelihood of needing to take stronger action in the future.

  • Philadelphia Semiconductor Index Erases 5% Gain, Turns Lower

    On July 31, U.S. chip and semiconductor stocks rapidly weakened, with the Philadelphia Semiconductor Index wiping out a 5% gain and turning lower. Micron Technology, which had risen 6%, is now down 4.2%. SanDisk, which had gained nearly 10%, is now down over 6%. SK Hynix and Seagate Technology, which had risen over 8%, are now down 2%. TSMC, which had gained 4%, is now down nearly 1%.