


Following an explosive month of volatile price action, Bitcoin is consolidating above the on-chain cost-basis of several cohorts. Despite a -6.2% pullback to a weekly low of $22.6k, the average BTC holder is now holding an unrealized profit, with several macro scale on-chain indicators suggesting turning of the market tides is potentially underway.
In this edition, we shall explore this from the lens of spending activity in response to the recent price uptick, considering a wide cross section of the market. The goal is to identify emerging behavioral patterns to gauge shifting macro tides. We shall also investigate whether the incentive to sell is starting to overpower the opportunity cost of HODLing (and how we can identify this shift), as well as the relationship between mature and new participants, as capital begins to change hands.
A Return to Profitability
We shall begin our investigation by analyzing the realized profits locked in by the market during the most recent cycle. We can see a explosion in profit taking after Oct 2020 in response to extraordinary monetary policy. This can be seen to diminish dramatically since the peak in Jan 2021, detoxing over the following two years back to 2020 levels.
An recent resurgence in realized profits can be observed in response to recent price action, however, it remains muted in response to the exuberance experienced throughout the 2021-22 cycle.

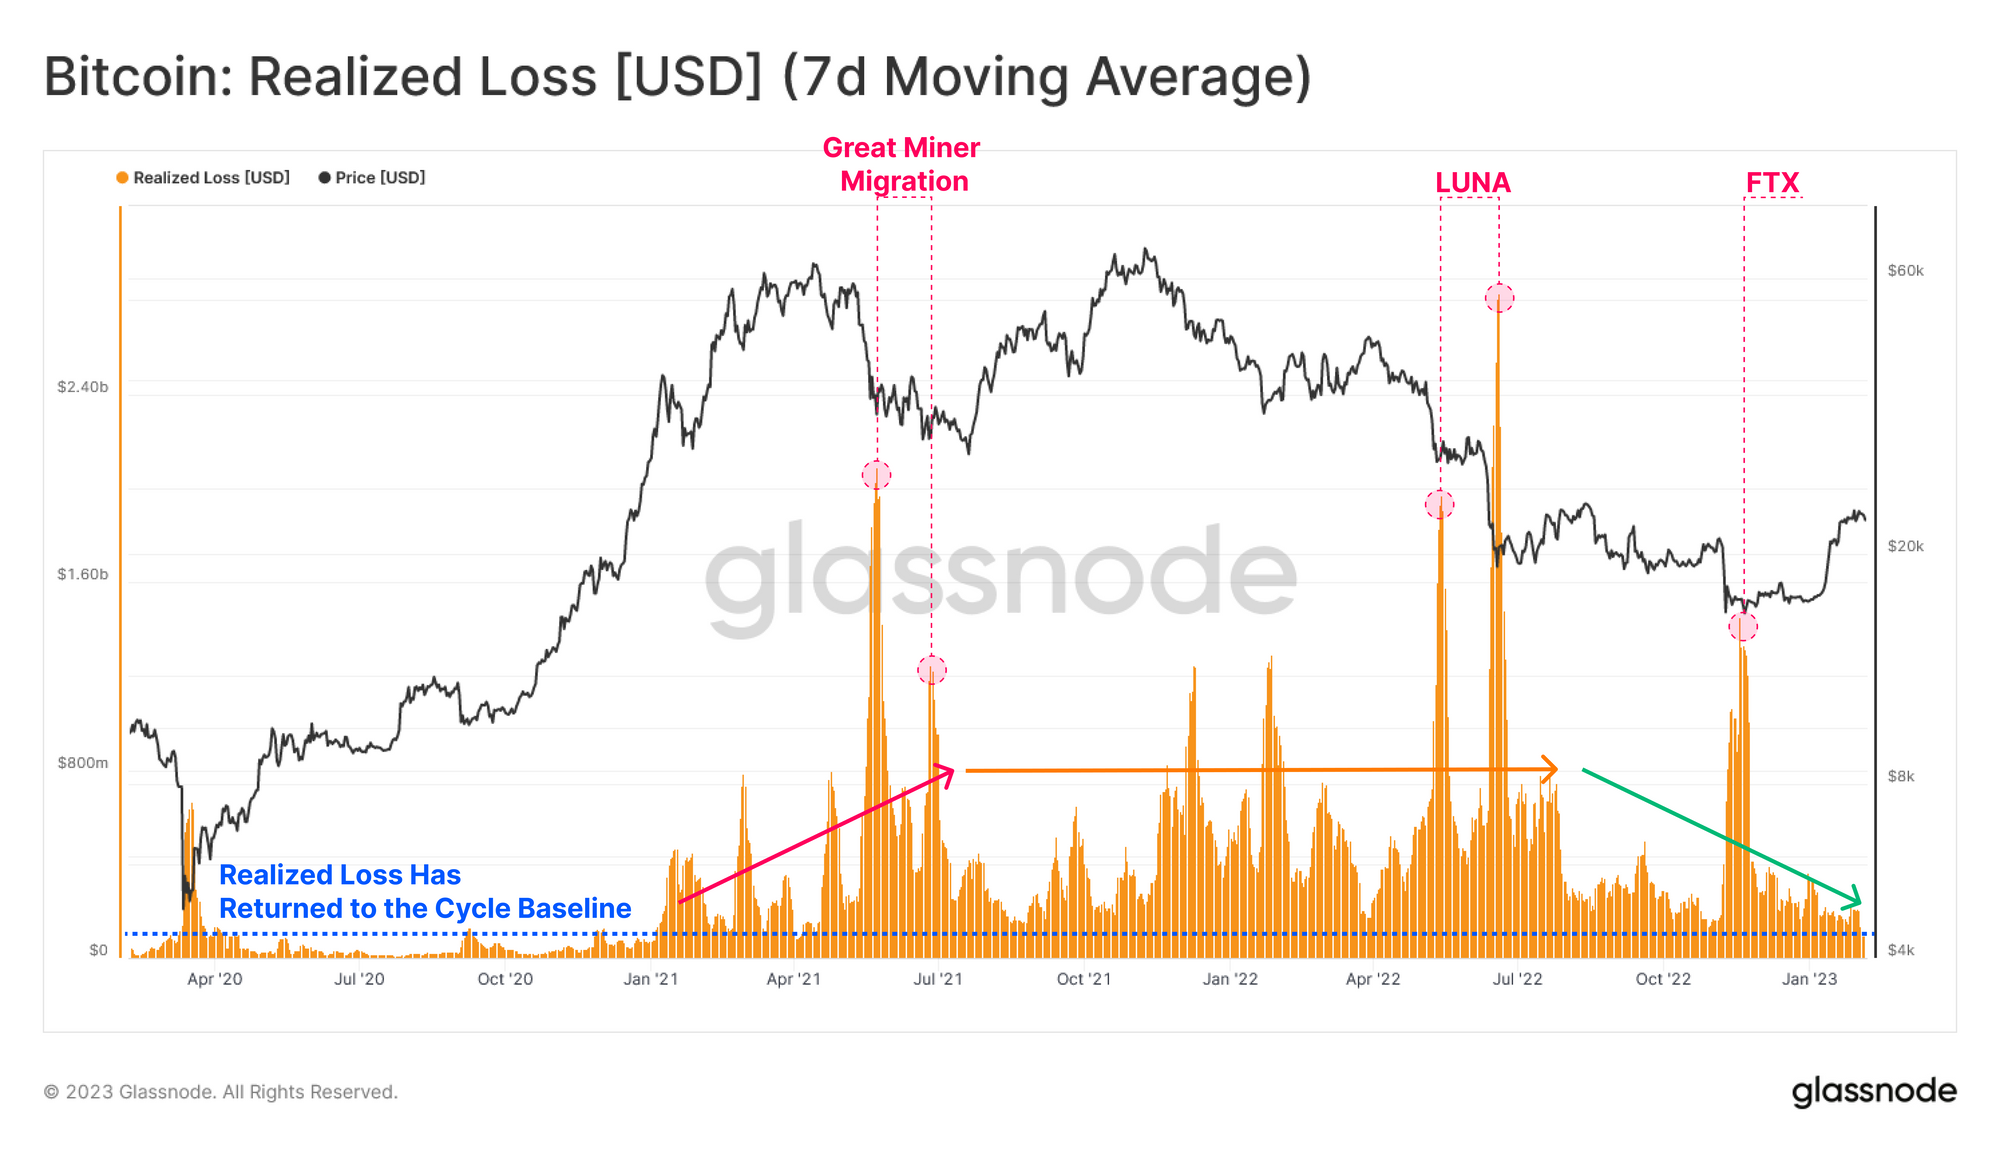
The losses realized by the market over this same time-frame started to expand after Jan 2021, reaching an initial peak on the May 2021 sell-off (A Bear of Historic Proportions).
However, it can be seen that the present level of realized losses has declined towards the cycle baseline of around $200M/day, with an overall contraction in loss profile barring explicit capitulation events (e.g. LUNA / FTX).
Taking ratio between Realized Profits and Losses, we can identify structural changes in dominance between the two. Following the collapse in price action after the Nov 2021 ATH, a regime dominated by losses ensued, driving the Realized P/L Ratio below 1, with increasing severity with each subsequent capitulation in price action.
Nevertheless, we can observe the first sustained period of profitability since the Apr 2022 exit liquidity event, suggesting initial signs of a change in profitability regime.
🔔Alert Idea:Realized P/L Ratio (7D-EMA) falling back below 1.0 would indicate a large increase in realized loss dominance, indicating increased spending by investors holding coins with a higher cost basis.

The Bitcoin Sell-Side Risk Ratio is a metric we can use compare the magnitude of total realized profit and loss as a percentage of the Realized Cap (a measure of network valuation).
From this lens, the combined volume of realized profit and loss remains relatively small compared to the asset size. This indicates that magnitude of spending events remains marginal in scale, especially relative to the euphoria experienced during the bull market, and the FTX capitulation event.
Overall, this suggests that in aggregate, most coins that are on the move were acquired relatively close to the current spot price, and thus are not locking in a large ‘realized’ payload.

Back in the Green
Net Unrealized Profit/ Loss Ratio (NUPL) shows that the recent rally has launched the spot price of Bitcoin above the average acquisition price of the wider market. This puts the market back into a regime of unrealized profit, where the average holder is back in the green.
Comparing the duration of negative NUPL across all past bear markets, we observe a historical similarity between our current cycle (166-days) and the 2011-12 (157-days) and 2018-19 (134-Days) bear markets. The 2015-16 bear market remains a standout with respect to bear market duration, experiencing a regime of unrealized loss nearly twice as long as the runner up (2022-23 cycle).

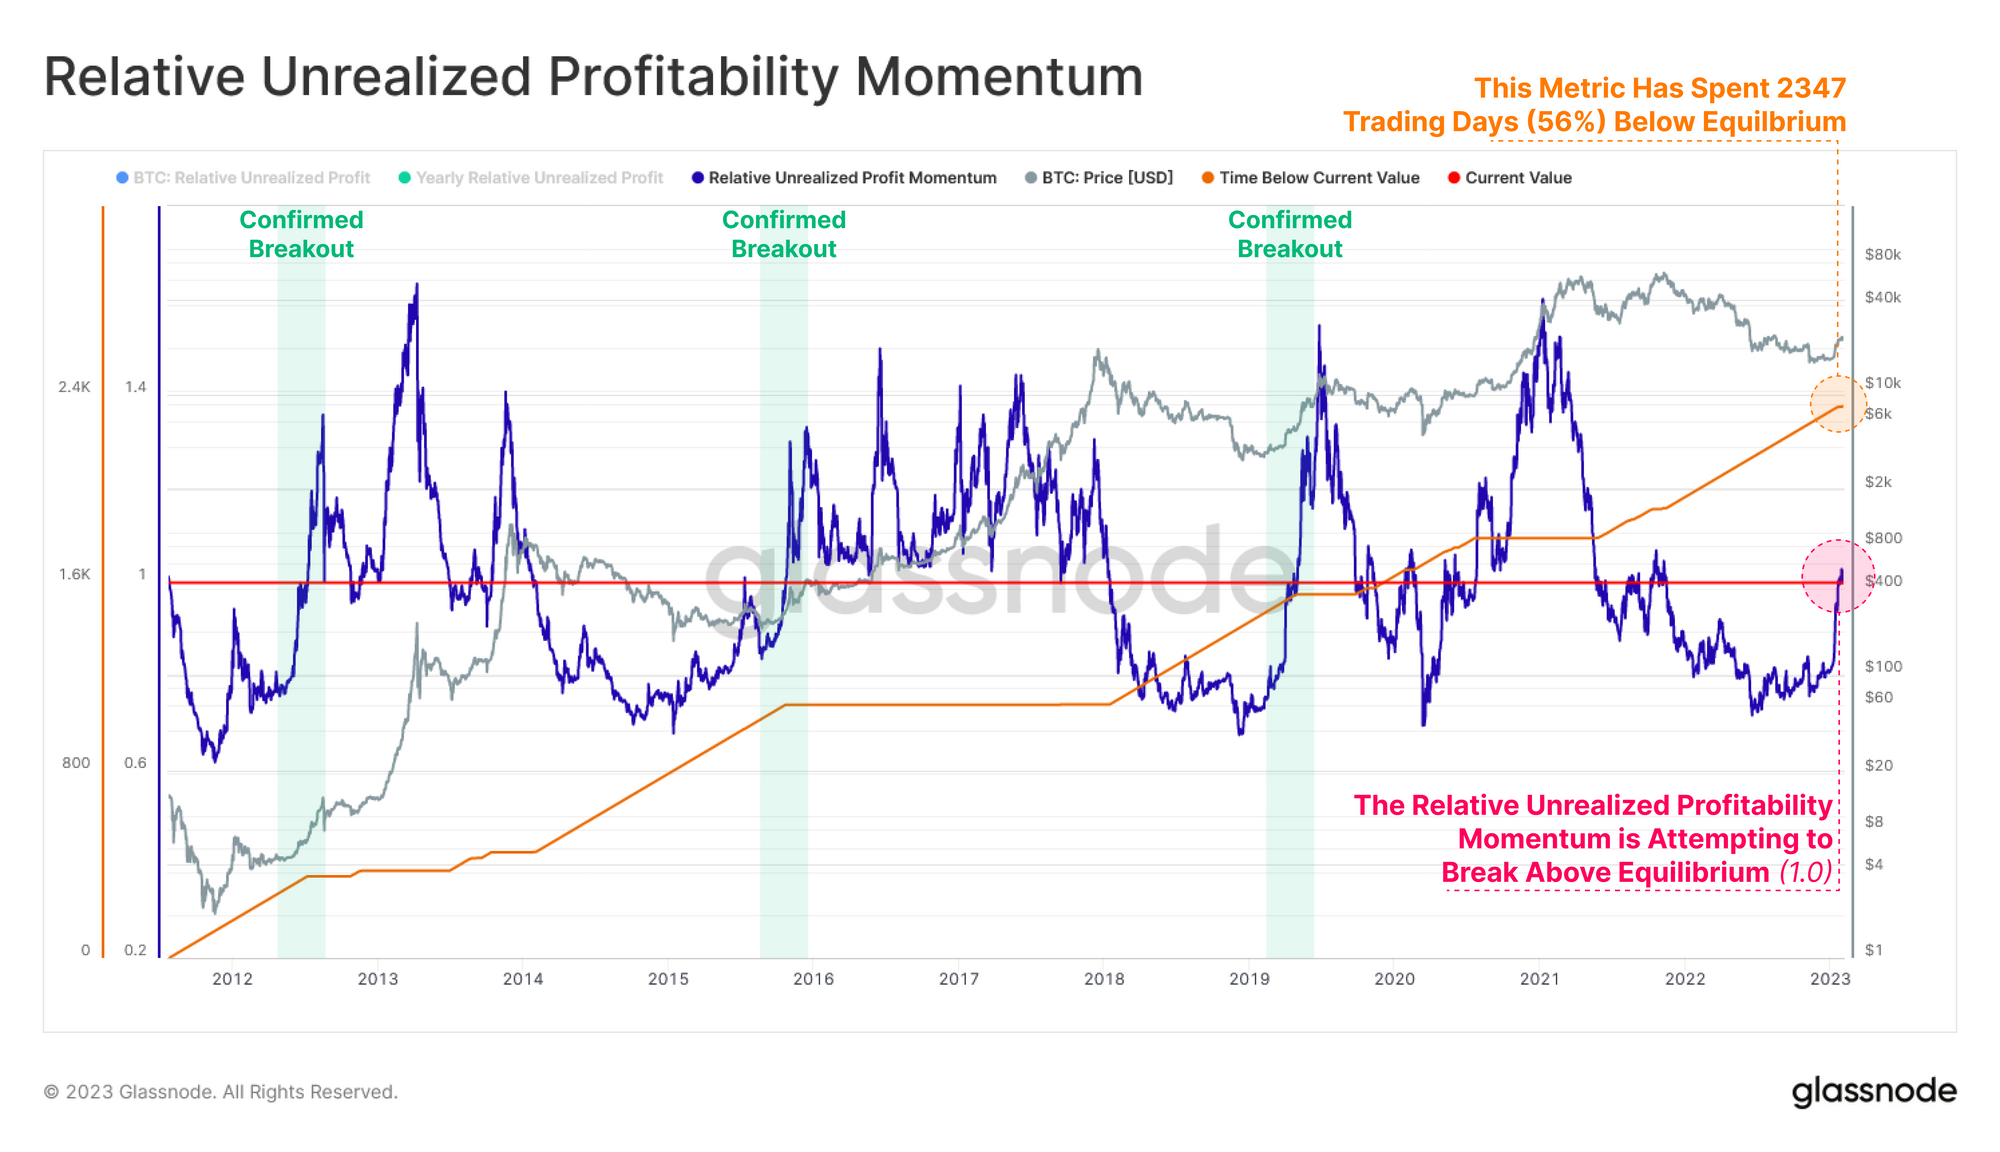
The ratio between the total unrealized profit held by the market and its yearly average can then provide a macro scale indicator for a recovering market.
The recent surge in price action has rallied above several aggregate on-chain cost-basis models, resulting in a significant improvement in the market financial position. This momentum metric is now approaching an the equilibrium break point and bears similarity to the recoveries from the 2015 and 2018 bear market years.
Confirmed breakouts above this equilibrium point have historically coincided with a transition in macro market structure. We also note that the length of time elapsed below this equilibrium point has been similar across major bear markets.
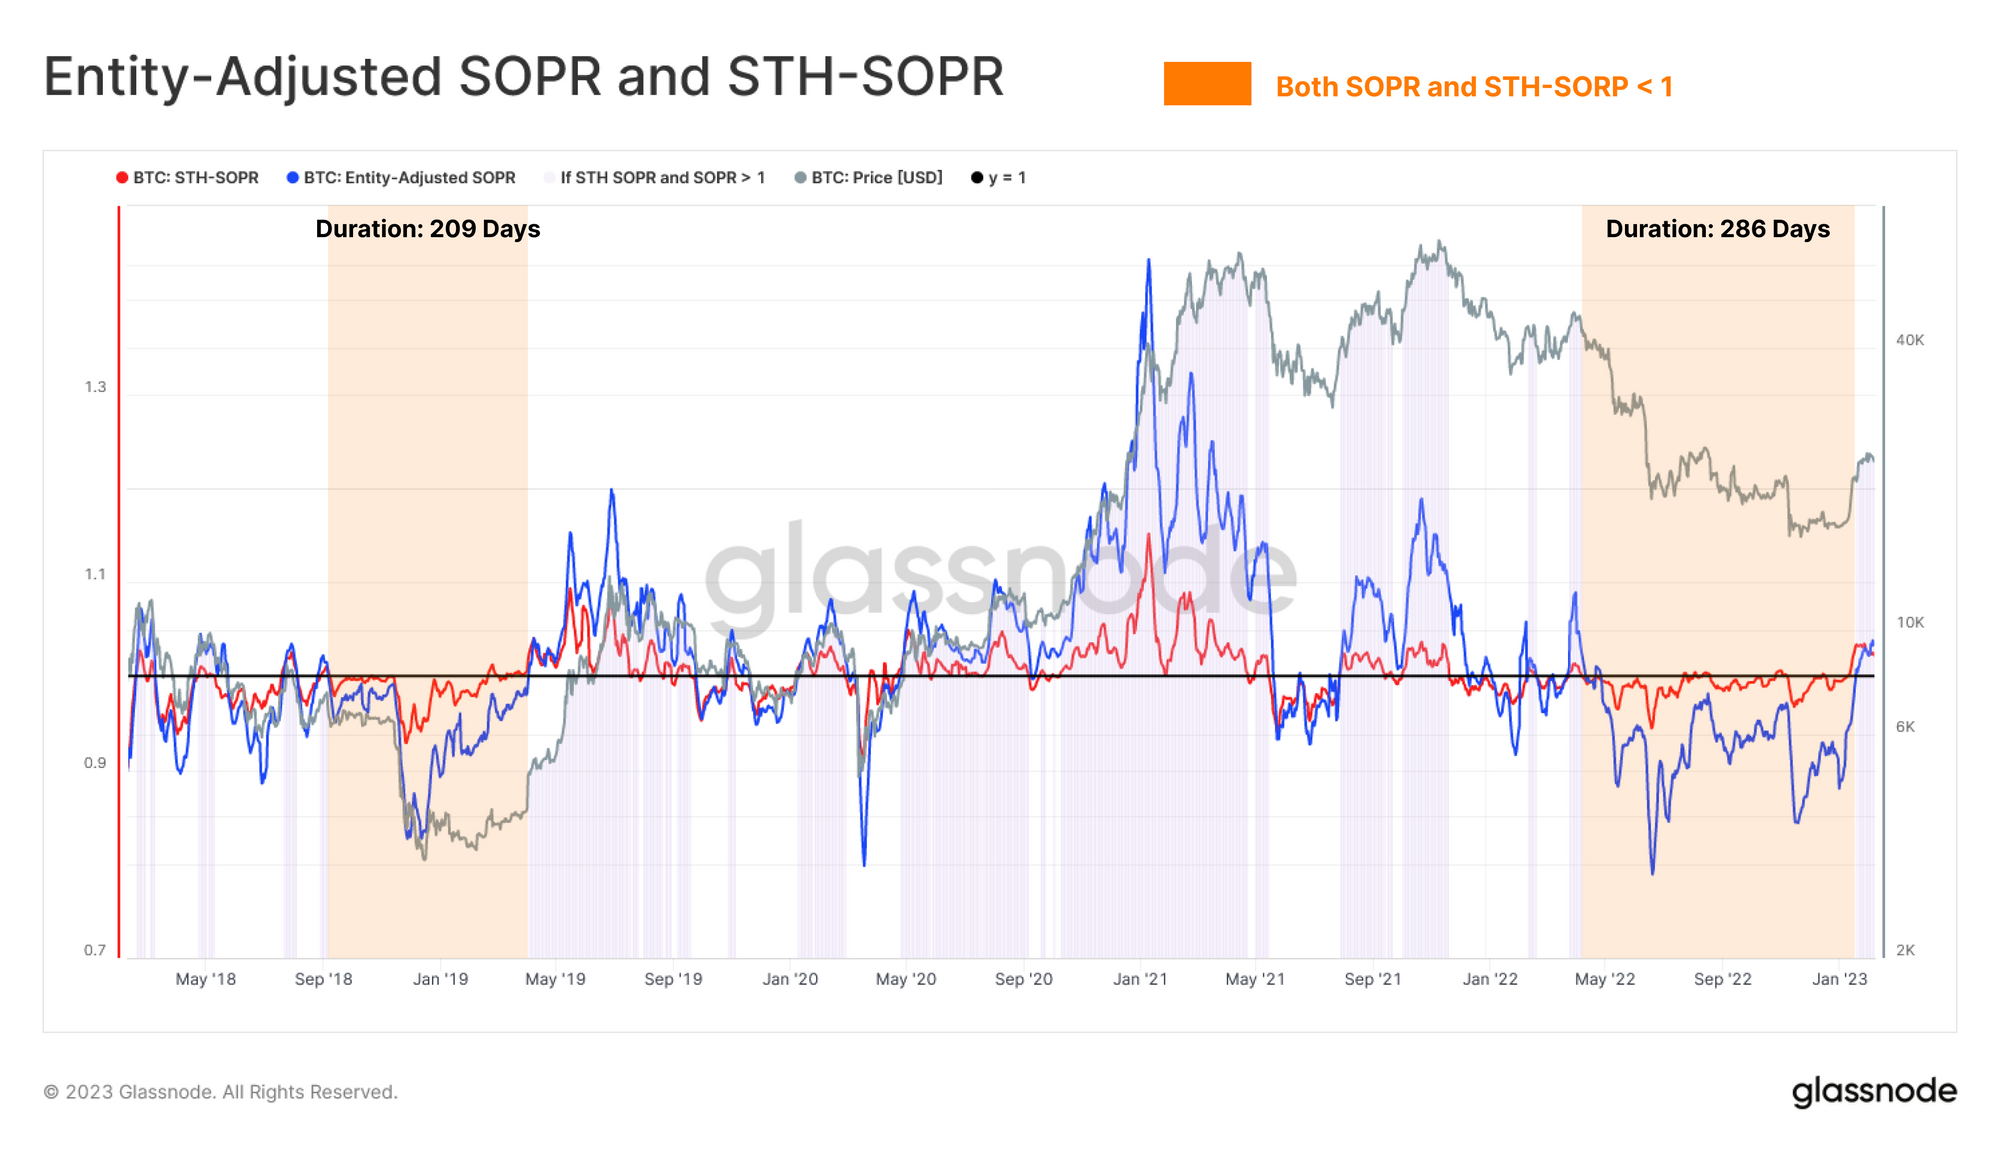
Variants of the SOPR (Spent Output Profit Ratio) metric can be used to inspect the aggregate profit multiple locked in by a variety of market cohorts on any given day.
For the Short-Term Holder cohort 🔴, it can be seen that STH-SOPR is now trading above a value of 1.0 on a sustained basis, displaying the first burst of profit taking since March 2022. This reflects the large volume of coins acquired at lower prices over recent months.
The wider market 🔵 has also seen a return to profitable spending, recovering after a very deep and extended period of heavy losses.
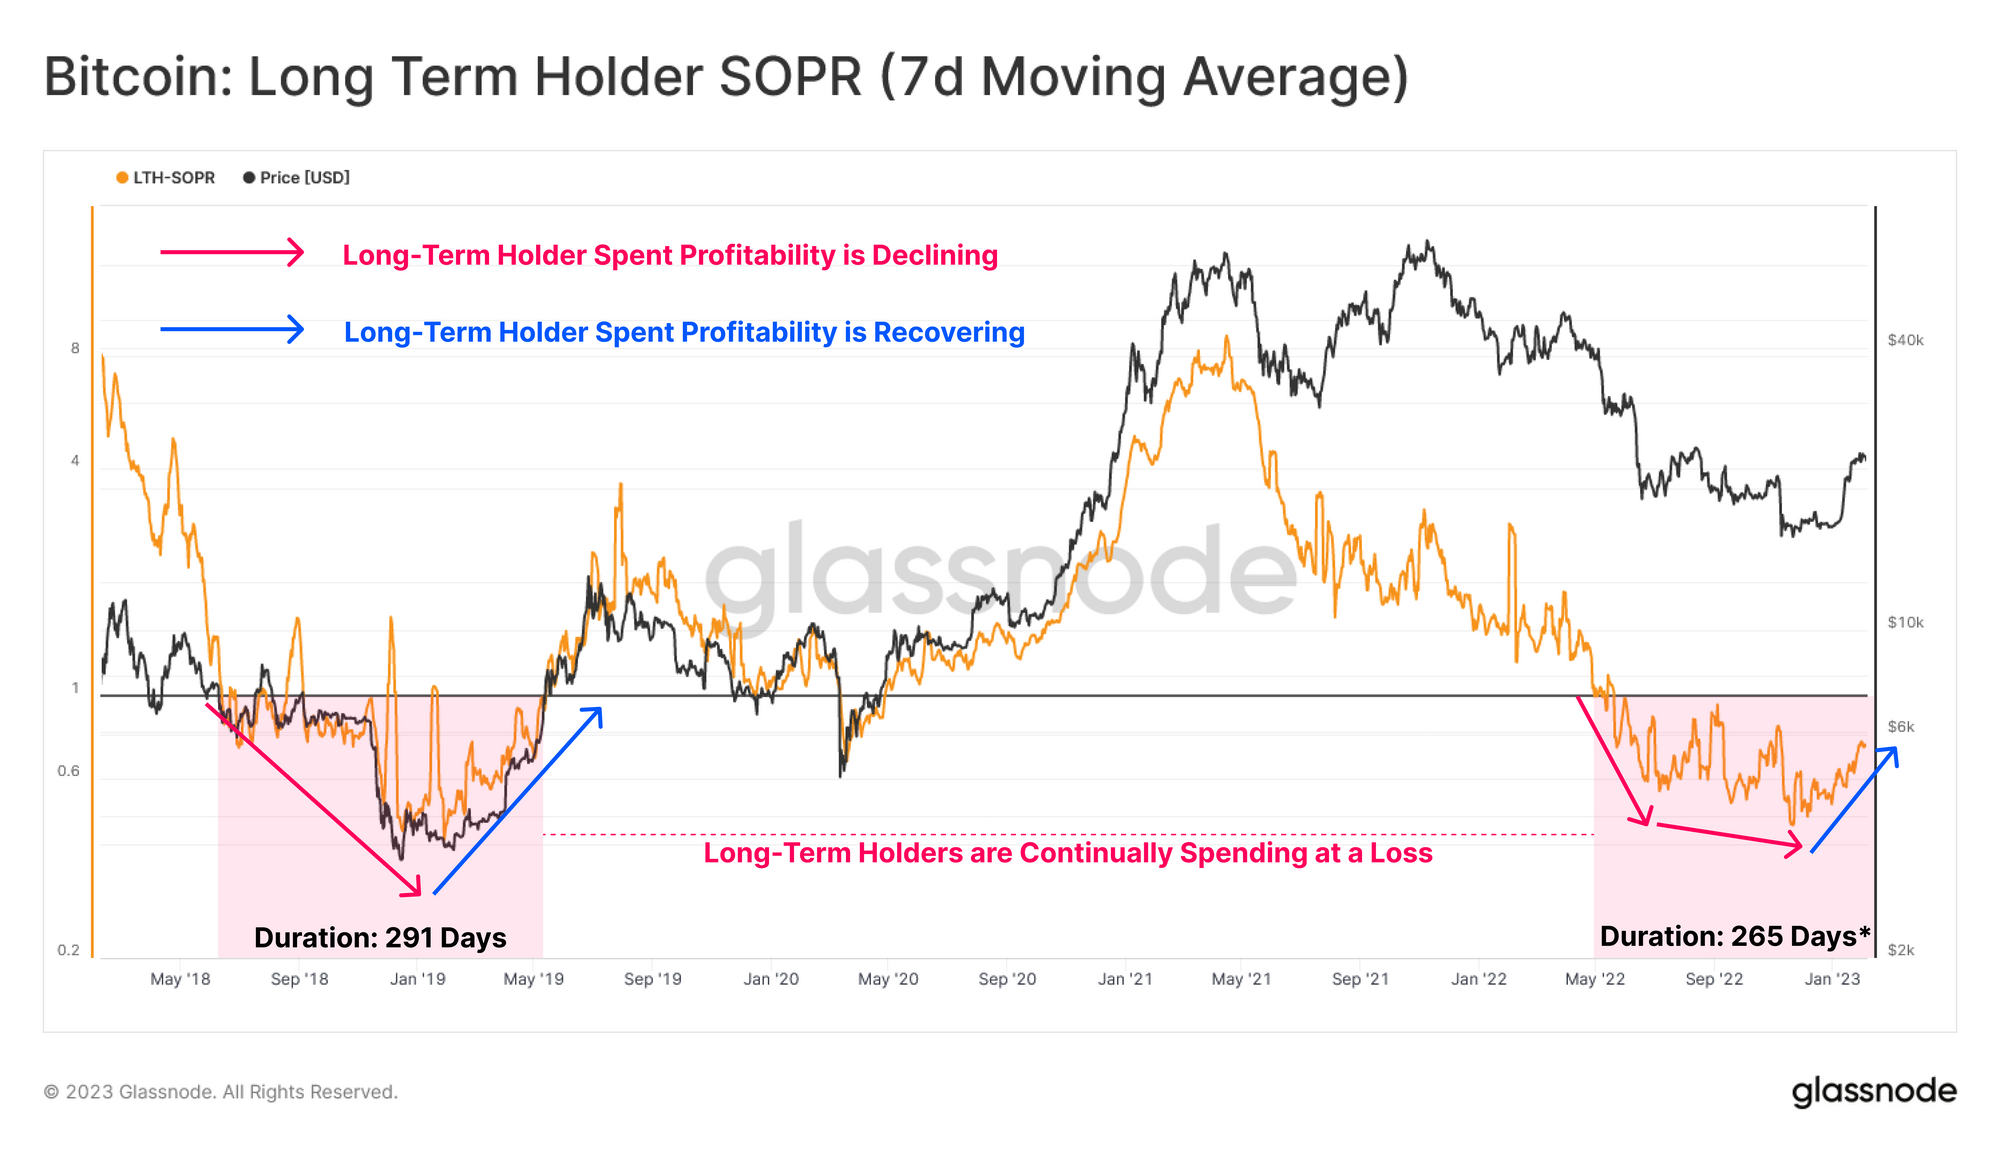
Assessing the Long-Term Holder cohort, we can observe a persistent regime of sustained losses since the LUNA collapse. Despite this cohort continuing to take losses over the last 9 months, there are initial signs of a recovery, with a potential uptrend in LTH-SOPR starting to form.
A Shift in Character
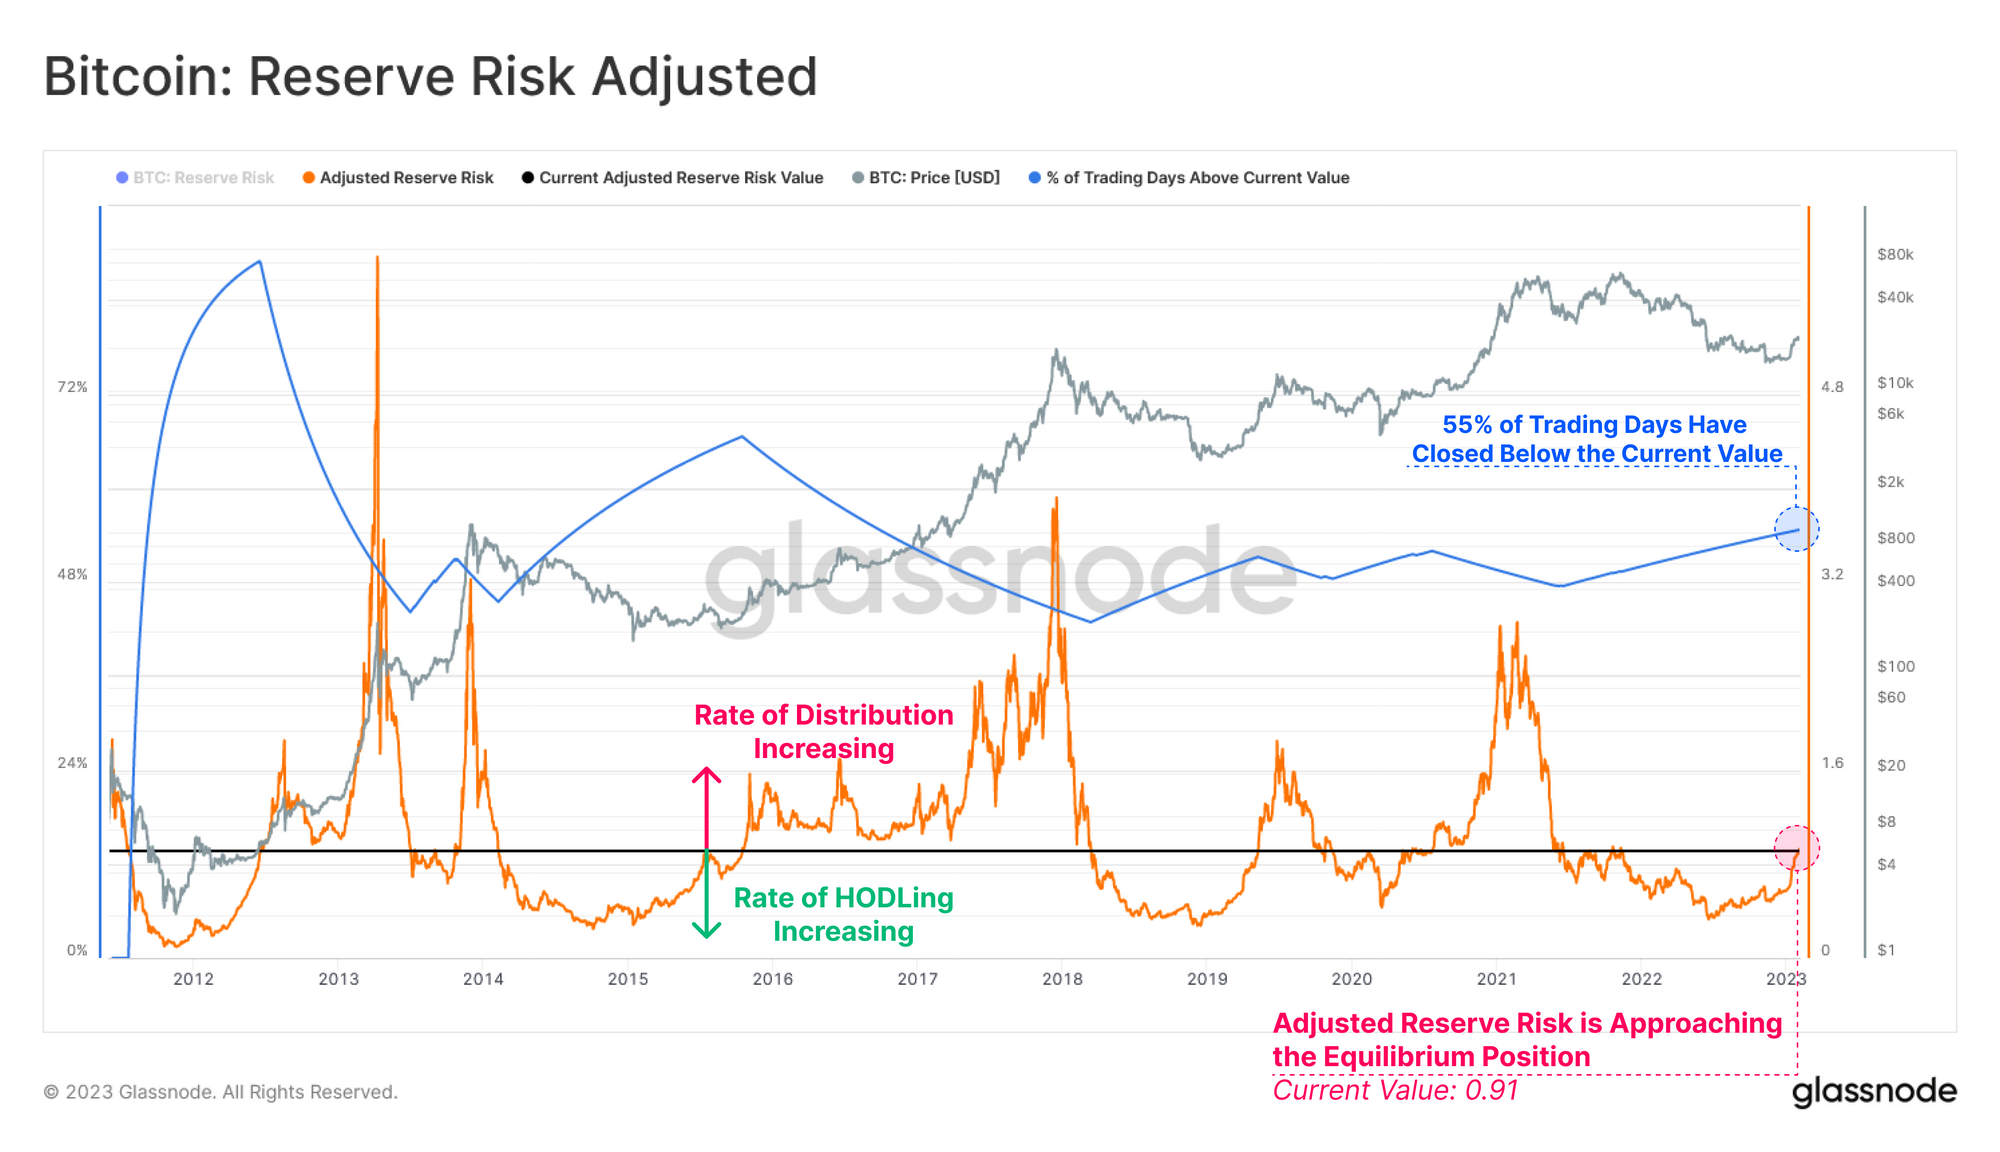
The Adjusted Reserve Risk metric can be used to contextualize the behavior of the HODLer class. This cyclical oscillator quantifies the balance between the aggregate incentive to sell, and the actual expenditure of long dormant coins.
- Higher values indicate both price, and HODLer spending is elevated.
- Lower values indicate both price, and HODLer spending is declining.
A structural change in the trend appears to be underway, as this oscillator continues to approach its equilibrium position (with 55% of all trading days below the current value). This suggests that the opportunity cost of HODLing is decreasing whilst the incentive to sell is increasing.
Previous break-outs above this equilibrium position have historically denoted a transition from a regime HODLing, to one of increasing profit realization, and a rotation of capital from older bear market accumulators, back towards newer investors and speculators.
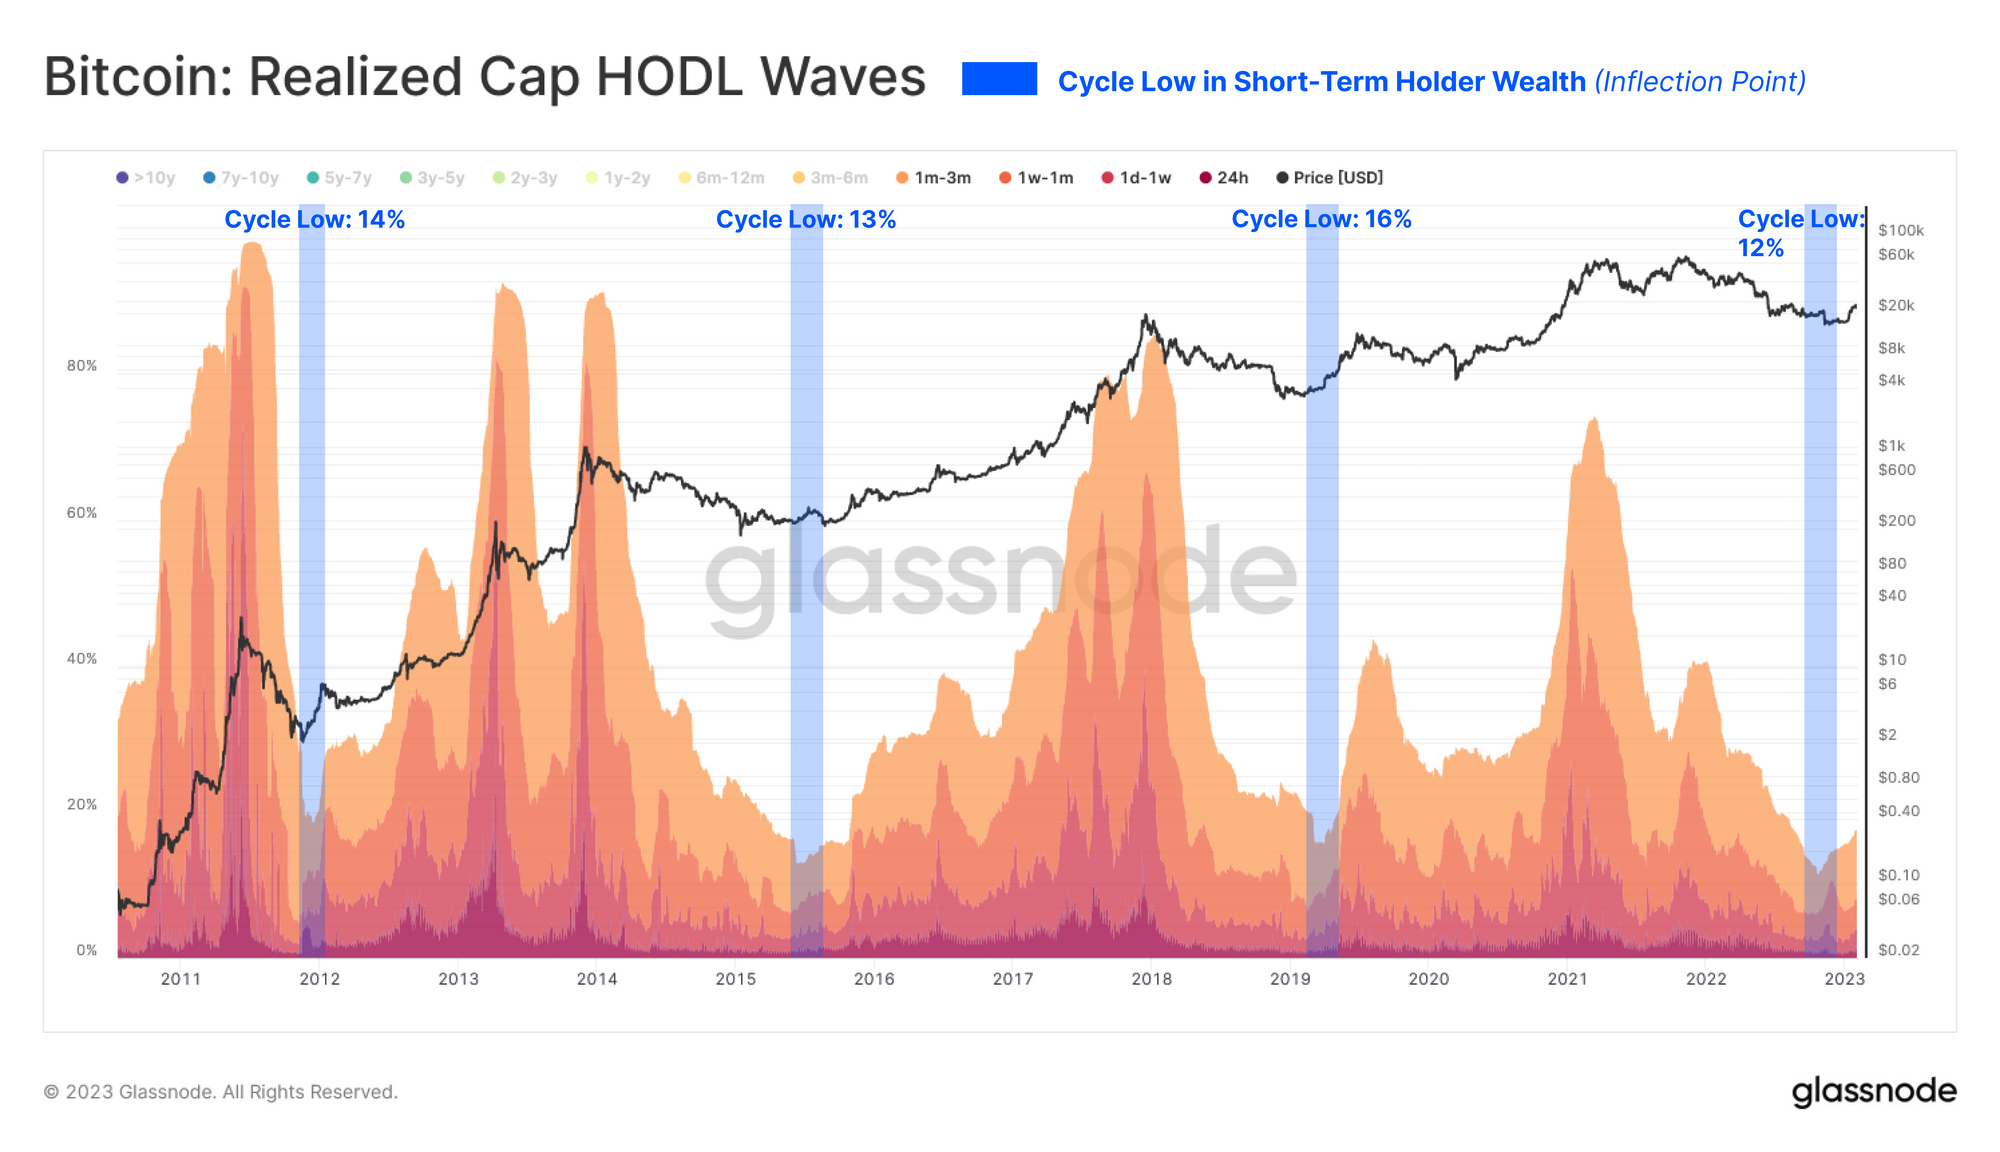
We can add weight to this thesis of capital rotation by inspecting the Realized Cap HODL Waves. Here we have isolated for coins held for 3 months or less, and note two key observations:
- The percentage of wealth held by newer holders is increasing, albeit marginally. Since this is a binary system, this indicates that wealth must be transferring from older hands to newer ones.
- The depth of this inflection point is very much in line with historical precedence.
Subsequently, we can employ the Realized HODL Ratio to further supplement the above observation. This metric compares this balance of wealth held between between 1-week and 1y-2y old coins, producing a macro scale oscillator.
- Higher values indicate a disproportionate wealth held by new buyers and speculators.
- Lower values indicate a disproportionate wealth held by long-term, higher conviction HODLers.
When assessing the Realized HODL Ratio, both the rate of change and the trend direction are generally of greater importance than the absolute value. Currently, we are witnessing a rounding bottom structure forming, suggesting a net transfer of wealth is taking place, as well as the trend beginning to transition to the upside.

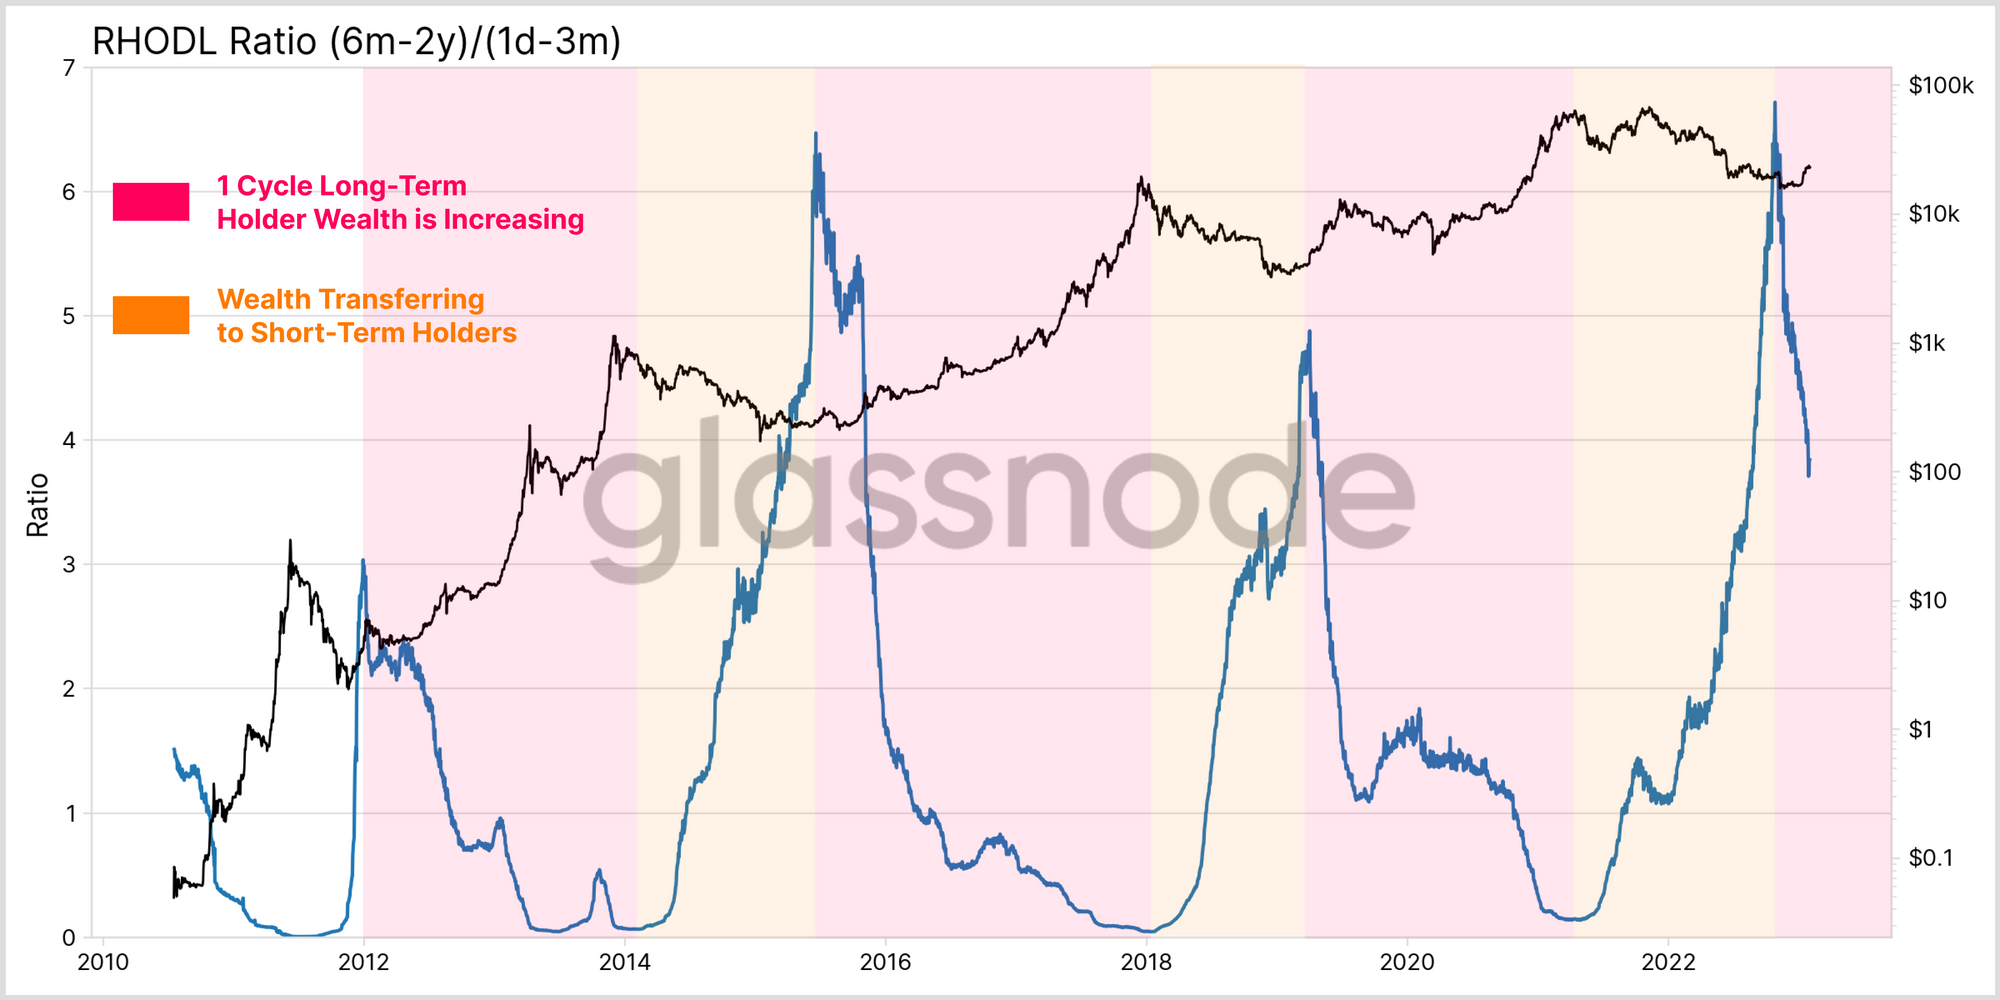
With this as context, we can introduce a new variation of the RHODL ratio, which compares the wealth held by single-cycle Long-Term Holders (6m-2y) to the youngest Short-Term Holders (1d-3m). This seeks to evaluate the capital rotation turning point across cycle transitions.
Wealth can only leave the 6m-2y cohort by either maturation into a more senior age band, or via the spending of coins, resetting the age of the coin entirely. Currently, we can see a large and sharp inflection point in this RHODL Ratio variant, suggesting a significant and sudden rotation of capital from last cycle’s Long-Term Holders to a new cohort of buyers.
This market phenomena has been strikingly consistent across prior bear markets, with large inflections in capital rotation signalling a significant change in market character and structure.
Summary and Conclusions
After an extended and savage bear market, marred by consecutive deleveraging events, there are signs that full detox of exuberance has taken place, and a cyclical transition may be underway. Usually these periods are punctuated by a sharp change in aggregate profit and loss dominance, which appears to be taking place.
However, this trend remains young, both from the lens of duration, and of magnitude of realized profit and loss relative to the market size. As previously discussed in the WoC#45, the rotation of capital from Long-Term Holders to the Short-Term Holder cohort has been a persistent trend over the last 12-months. This is elegantly reflected in the growing wealth held by the Short-Term Holder cohort, absorbing coins from their Long-Term Holder counterparts who continue to distribute (generally at a loss).
It appears that the market is within a transitional phase, evolving from the late stages of a bear to the beginning of a new cycle. With past cycles as a guide, the road ahead remains an arduous one, with key examples being 2015, and 2019. These transitional periods historically been characterized by an extended macro sideways market, littered with local volatile moves, usually in both directions.
Disclaimer: This report does not provide any investment advice. All data is provided for information and educational purposes only. No investment decision shall be based on the information provided here and you are solely responsible for your own investment decisions.



All Comments