


The information, opinions, and judgments regarding markets, projects, currencies, etc. mentioned in this report are for reference only and do not constitute any investment advice.
Written by 0xWeilan
"Currently, with the prospect of interest rate cuts becoming increasingly uncertain and risk appetite not yet fully recovered, cyclical selling (the cyclical pattern) has become the main force driving BTC's price movement. Without further economic and employment data to support this, the shift in risk appetite will drive funds back into the market, and with continued long-term selling, once BTC effectively breaks below the bull-bear dividing line, a 'long squeeze' may occur, and the probability of the BTC cycle ending will increase significantly."
Ultimately, BTC experienced the "long squeeze" sell-off we predicted in our October report, falling 17.51% in a single month, marking the second-largest monthly drop in this cycle. By the end of the month, the maximum retracement from the high reached 36.45%, the largest in this cycle.
Technically, BTC once broke below the "Trump bottom" formed by the $90,000-$110,000 range and has been trading below the 360-day moving average for three consecutive weeks. In terms of both price and time, a daily-level "bull-to-bear" reversal has been confirmed, and weekly-level confirmation is underway. Monthly-level confirmation remains to be seen.
The short-term liquidity crunch caused by the US government shutdown, coupled with the rollercoaster-like swings in expectations of a Federal Reserve rate cut due to chaotic economic and employment data (expectations of medium-term liquidity crunch), triggered a large-scale sell-off/hedging of high-beta assets by global funds, as well as cyclical movements within the crypto market. These factors are the fundamental reasons for the extreme price movements in BTC and the entire crypto market. The unpredictability of macro liquidity makes it increasingly difficult to judge the "transition from old to new cycles" in the crypto market.
In this report, we will conduct a structured analysis of the November market based on EMC Labs' "BTC Cycle Multi-Factor Analysis Model" in order to find the logic and path of the decline, and to make a judgment on the medium-to-long-term trend of "medium-term adjustment" or "transition to a bear market".
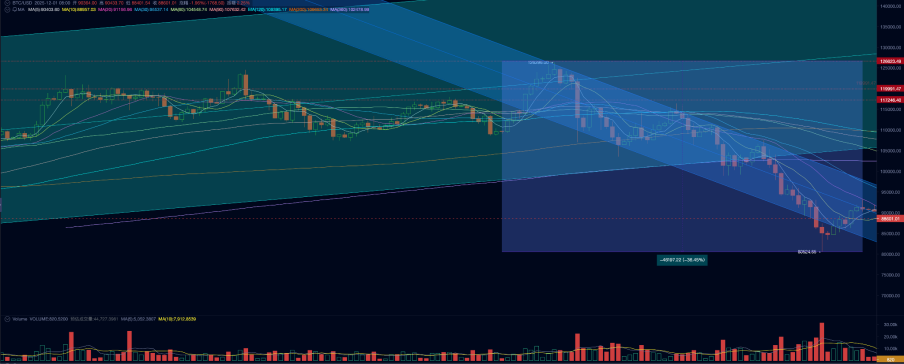
BTC price daily chart
Liquidity Crisis: Depletion and Uncertainty
As of November 12, the US government shutdown had lasted 43 days, setting a new record. During the shutdown, fiscal spending was significantly reduced, but revenues such as taxes and tariffs continued to flow in, creating a "one-way inflow, no-outflow" cash flow accumulation that directly increased the Treasury's TGA account balance at the Federal Reserve, resulting in a strong "drain" of liquidity into the market.
The Total Gains Trust (TGA) balance increased by over $200 billion in a single month, bringing the total balance close to $1 trillion. This drained private sector bank reserves, creating a "liquidity vacuum." Bank reserves fell from approximately $3.3 trillion to approximately $2.8 trillion, approaching the market's perceived lower limit of "ample reserves." Ultimately, the On-the-Job Repo Rate (ONR) and Solely Secured Overnight Financing Rate (SOFR) remained consistently higher than the International Interest Rate Receivable (IORB), making it difficult for trading institutions to obtain sufficient funds from banks, and even forcing them to repay loans.
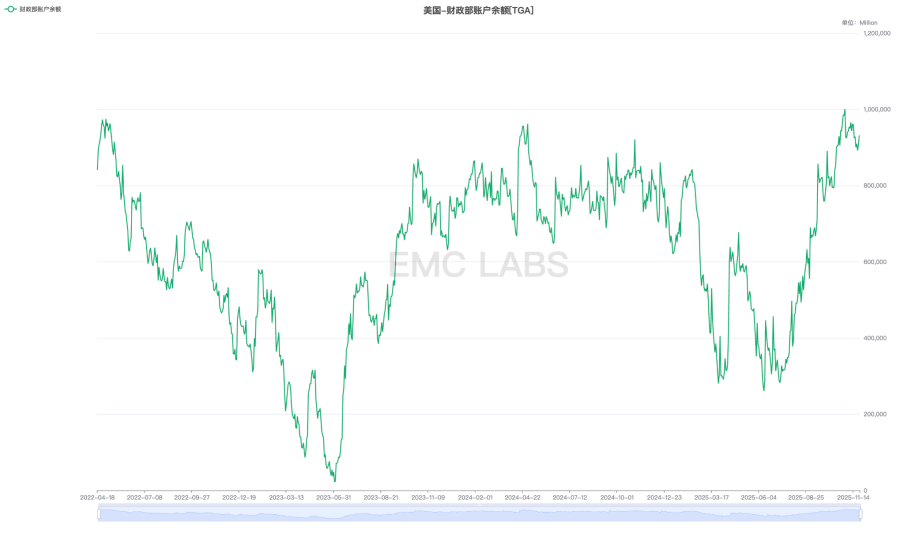
U.S. Treasury TAG account balance
The Federal Reserve announced its second interest rate cut of the year at its FOMC meeting on October 29. Many people judged that medium-term liquidity was being released, but they overlooked the micro-structural constraints—the actual liquidity released by the Fed into the market has been declining since late July.
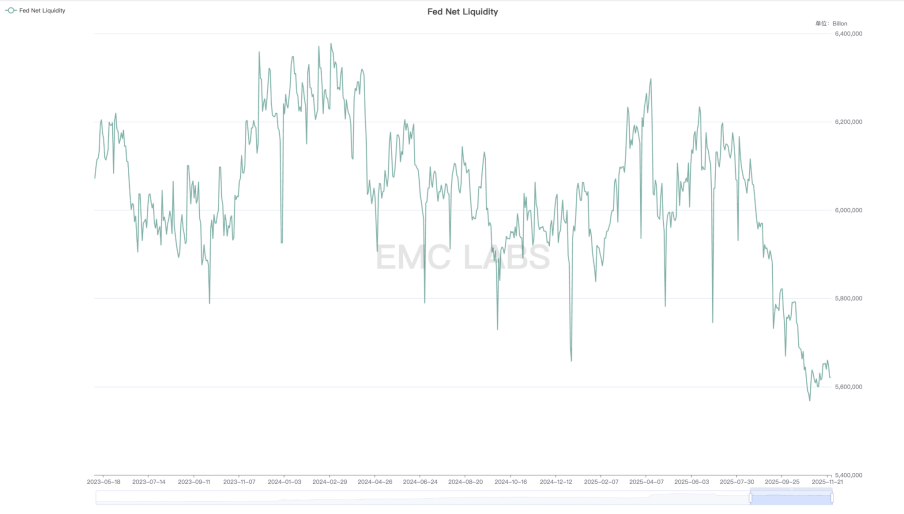
Federal Reserve net injection of market liquidity
Tight liquidity has driven up funding costs in the trading market, putting pressure on the valuations of US AI concept stocks and high-beta assets such as BTC.
EMC Labs noted that as actual liquidity gradually dried up, market risk appetite deteriorated, and valuation pressures eventually led to the successive sell-off of high-beta assets, with BTC being the first link in this sell-off chain.
In early October, BTC ETFs saw a large inflow of funds, pushing BTC to a new all-time high. Subsequently, following the Federal Reserve's market liquidity injection, the inflow of funds plummeted and began to turn into outflows, which have been the main trend since then.
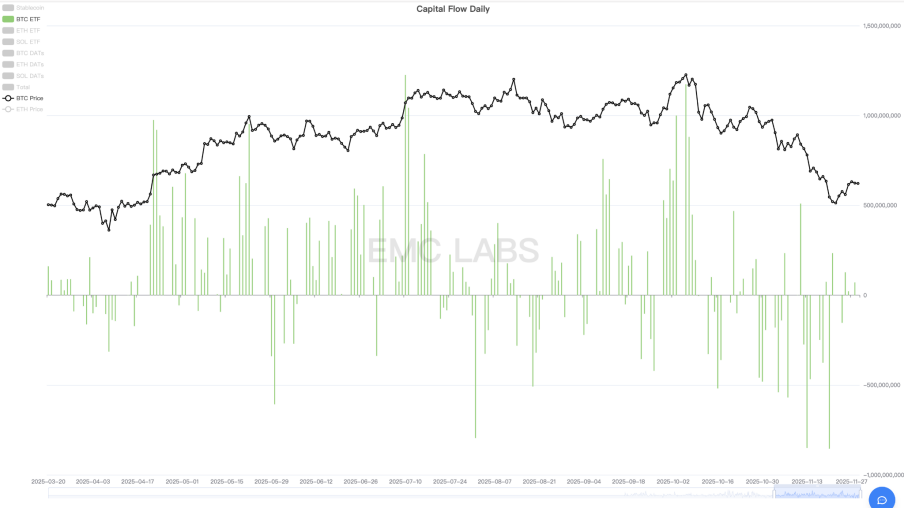
Statistics on fund inflows and outflows for 11 US ETFs (Daily)
As high- beta assets, Nasdaq AI concept stocks outperformed crypto assets that lacked fundamental support. After BTC began to fall and rebalance, it continued to reach new historical highs, driven by better-than-expected earnings reports from seven major companies, until it began to break down on November 4.
Following the breakdown in US stocks, funds in the crypto market accelerated their outflow. On one hand, there was a continued withdrawal of funds from BTC ETF channels, and on the other hand, there was further selling by long-term investors within the market. This caused BTC, which had fallen earlier than the Nasdaq, to break down further and reach the same low point in this round of correction as the Nasdaq on November 21.
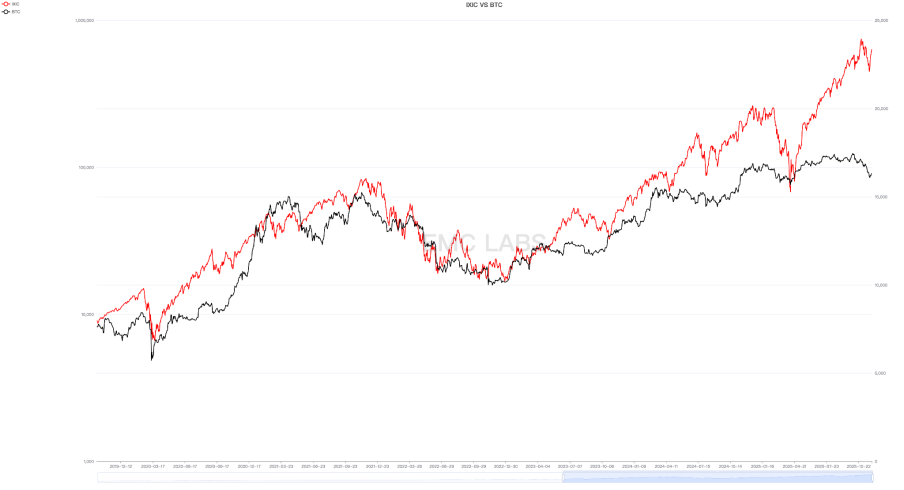
Nasdaq vs. BTC price movements
During this period, BTC's correction started nearly a month earlier than the Nasdaq's, and the magnitude was nearly four times that of the Nasdaq (BTC: -36.45%, Nasdaq: -8.87%), with a greater elasticity than 2 to 3 times that of the previous period.
In addition to short-term liquidity pressures, we continue to focus on a key indicator of medium-term liquidity expectations —the probability of a Fed rate cut in December. In October, the probability of a December rate cut reached as high as 98.78% (October 20th), before falling to a low of 30.07% (November 19th) driven by continued hawkish pronouncements from Fed officials. This weakening of medium-term liquidity expectations and the resulting shift in risk appetite has undoubtedly exacerbated traders' sell-off of high-beta duration assets.
On November 12, the US government ended its shutdown, and short-term liquidity began to be released slowly. However, the Federal Reserve's continued hawkish stance has reduced the probability of a rate cut in December after the shutdown. We believe that the initial genuine short-term liquidity shortage, followed by pessimistic expectations for medium-term liquidity, jointly dominated the current decline and price rebalancing in the US stock and cryptocurrency markets.
The true turning point for both BTC and US stocks occurred on November 21st. That Friday, John Williams, the third-ranking official at the Federal Reserve and president of the New York Fed, stated in a public forum that downside risks to employment had increased and there was room for further adjustments to the federal funds rate to bring the policy stance closer to the neutral range. This statement was interpreted as reflecting the opinion of the Fed's management, and the probability of a December rate cut quickly rose to over 70% in trading that day. Both US stocks and BTC reversed their losses and began to rise.
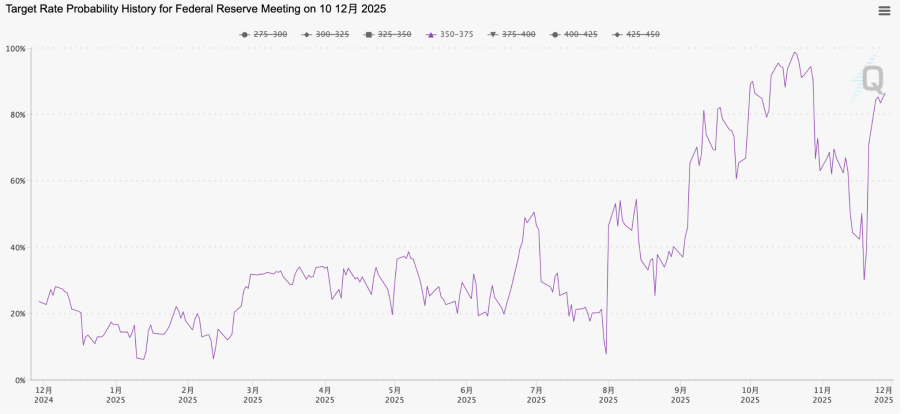
FedWatch predicts a 25 basis point rate cut by the Federal Reserve in December.
Then, on November 26, the Federal Reserve's Beige Book was released, indicating that the economic and employment situation was indeed deteriorating. This information further alleviated market concerns that the Fed might choose a conservative approach and not cut rates due to the lack of sufficient economic and employment data before the December rate cut meeting. The probability of a December rate cut gradually rose above 80% on FedWatch, reversing from Powell's statement on October 30 that it was "not a certainty" to "a certainty" a month later.
The November correction in US stocks also included concerns about the overvaluation of AI concept stocks, which led to a 20% drop in leading stock Nvidia, with a weak rebound. However, overall, it was more of a dual adjustment in risk appetite and valuation caused by short-term liquidity pressures and medium-term liquidity uncertainties. Therefore, with the emergence of a short-term liquidity inflection point, the probability of a December rate cut has returned to a high level, and the Nasdaq recorded gains in all four trading days of the last week of November, attempting to reclaim the all-time high set on October 29.
Although US stocks have rebounded strongly, short-term market risks seem to have been eliminated. However, liquidity risks have not been completely resolved, and short-term liquidity has not yet shown a significant recovery. Regarding medium-term liquidity, while a December rate cut is almost a certainty, whether further rate cuts will occur in the first quarter of next year will depend on subsequent economic and employment data.
Internal Structure: Repricing and High Turnover
The liquidity crisis has reached a turning point, and the Nasdaq may soon recover its previous historical high. However, the rebound in BTC is far less resilient, still more than 38% away from its historical high on October 6th. We believe that the weak price performance is due to two factors: firstly, BTC's inherent resilience is greater than that of the Nasdaq; and secondly, severe internal structural damage coupled with a "cyclical" sell-off.
First, according to eMerge Engine's statistics on the overall cryptocurrency market fund flows, we can see that the cryptocurrency market recorded an outflow of over $3.6 billion in November. Specifically, the BTC ETF channel saw $3.382 billion, the ETH ETF channel $1.352 billion, stablecoins $615 million, and the SOL ETF recorded a positive inflow of $412 million. Overall, the BTC/ETH/SOL treasury companies recorded positive inflows, totaling approximately $1.298 billion.
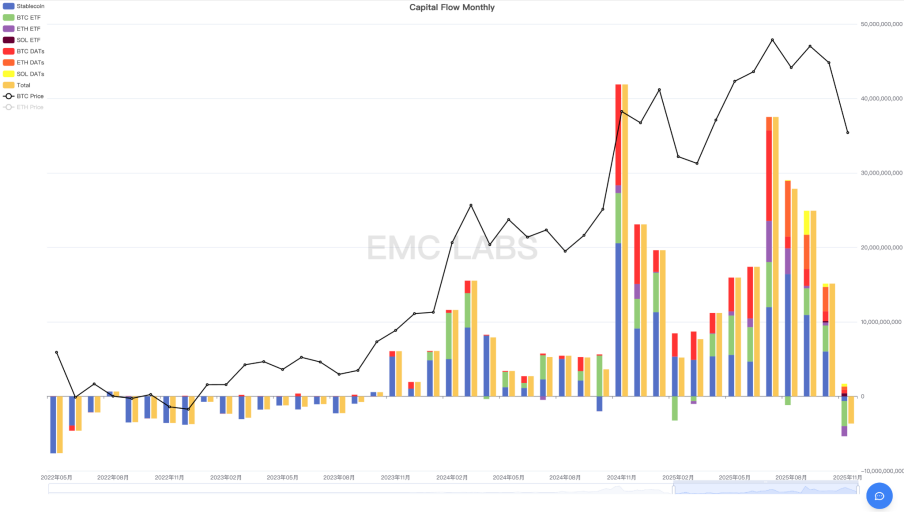
Crypto Market Omnichannel Fund Inflow and Outflow Statistics (Monthly)
In November, the crypto market as a whole recorded its largest monthly outflow of the cycle, marking a reversal after three consecutive months of declining inflows. This is the fundamental reason for BTC's largest drop this month. BTC ETFs accounted for 93.94% of the total outflow, so we attribute this correction primarily to the liquidity crisis's downward repricing of high-beta assets like BTC.
Secondly, the cyclical selling by long-term holders is also an important reason. Since the beginning of this period, long-term BTC holders have launched three large-scale sell-offs: the first wave was from January to March 2024, the second wave was from October 2024 to January 2025, and the third wave is the current deep correction in BTC prices from July to November 2027.
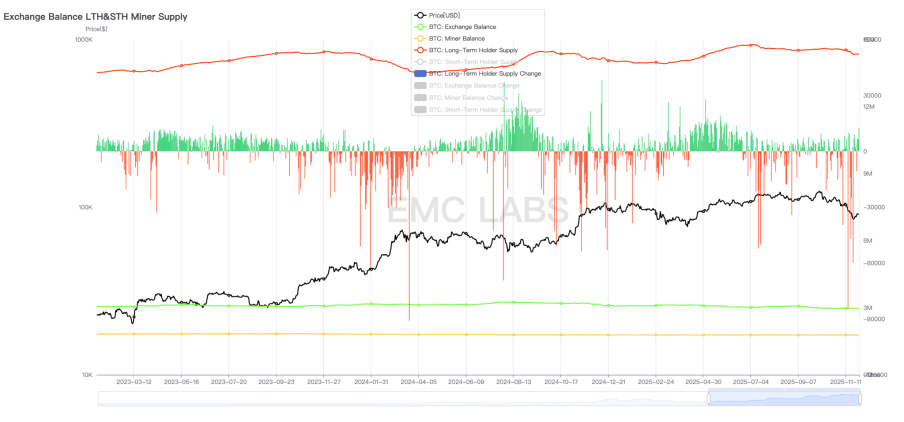
BTC Long-Term Holding and Position Change Statistics (Daily)
Unlike the previous two waves of large-scale selling during BTC price rallies, this wave of selling primarily occurred between July and November when prices were flat or even falling rapidly. This behavior by long-term holders is not unusual; it's consistent with their post-bull-to-bear market behavior. Considering the significant influence of the "ideological imprint" of the halving bull market that has developed over a decade, and the "coincidence" of reaching past bull market highs around October, we believe that a sufficiently large number of long-term holders are indeed adhering to the "cyclical law" and engaging in post-bull-to-bear market selling. This selling is a significant reason for amplifying the BTC price drop.
Finally, the current decline in BTC is not only due to the two factors mentioned above, but also to other negative factors such as the severe impact on futures arbitrage traders and the crypto market makers caused by the "Binance USDe de-pegging incident".
The dramatic drop has already occurred, with some selling off heavily and others taking the opportunity to add to their positions. Ultimately, a large-scale turnover of BTC occurred, and after the turning point in macro liquidity expectations, the market finally got a brief respite.
Through on-chain data analysis of BTC, we discovered that around $84,000, more than 430,000 BTC were repriced, marking a significant milestone in the history of BTC redistribution.
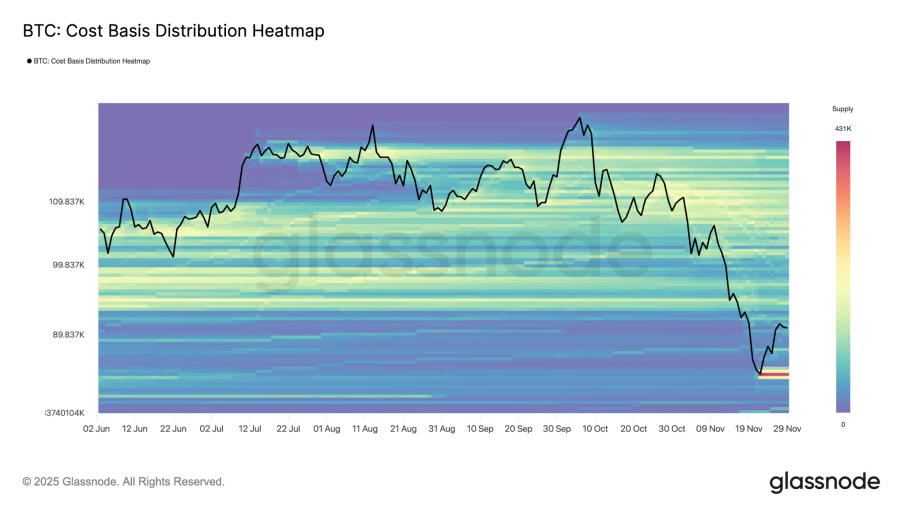
BTC on-chain cost distribution heatmap
BTC long-term holders continuously buy and accumulate tokens during market downturns, while gradually selling to new short-term holders during market upturns. This fundamental movement, along with BTC halvings, constitutes the traditional BTC cycle's bull-bear transition. Today, as BTC consensus spreads on Wall Street, the holding structure is undergoing a fundamental change, with BTC ETF holders and treasury firms becoming new long-term investors. We have discussed in our previous monthly reports whether the old cycle will change due to the new market structure, and whether the new cycle will shape a new pattern.
Today, we still don't have the answer. But if this long sell-off in BTC ultimately extinguishes market enthusiasm and the market trend is reversed, returning to a bear market, then we can say that a new cycle has not yet been successfully established.
Conclusion
In November, a short-term macro liquidity crunch and a pessimistic outlook for medium-term macro liquidity drove valuation cuts and downward repricing in sectors including Nasdaq AI stocks and crypto assets. Subsequently, both markets began to rebound as expectations shifted.
The internal dynamics and structural vulnerabilities within the crypto market have exacerbated the intensity of this adjustment.
In this round of adjustments, both the scale of capital outflow and the magnitude of BTC pullback were the largest in a single month since the beginning of this cycle.
Based on this logic, we believe the short-term price inflection point occurred on November 21st. Subsequently, with the December rate cut and the end of the Federal Reserve's quantitative tightening (QT), US macro liquidity will improve, and funds may flow back into the crypto market, further driving a price rebound. If it can reach new highs along with the continuation of the US stock market bull run in 2026, BTC will break away from the old cycle and enter a new cycle dominated by Wall Street institutions. If funds fail to flow back, it can be determined that the new cycle has failed to materialize, the old cycle will continue to dominate the market, and the BTC bull market since November 2022 will turn into a bear market, searching for a bottom again.
EMC Labs was founded in April 2023 by crypto asset investors and data scientists. Focusing on blockchain industry research and cryptocurrency secondary market investment, EMC Labs leverages industry foresight , insights, and data mining as its core competencies. It is committed to participating in the booming blockchain industry through research and investment, driving the benefits of blockchain and crypto assets to humanity.

For more information, please visit: https://www.emc.fund


All Comments