


Key takeaways
- Gemini serves as a powerful tool for research and idea generation, but should not be seen as a source of trading signals or personalized advice.
- While it effectively summarizes project fundamentals and compares assets, some responses, like Pi Coin’s delayed mainnet claim, highlight the risks of outdated or incomplete information.
- Using Gemini to reflect on past trades can help traders identify better timing and risk considerations, but market conditions evolve and human judgment remains essential
- Since Gemini Flash 2.5 lacks access to real-time data, it should always be used alongside up-to-date tools like TradingView, Nansen and CoinGecko.
The cryptocurrency market is a dynamic and often unpredictable landscape, where informed decision-making is paramount for traders. The rise of sophisticated AI models like Google Gemini offers a powerful new avenue for gaining an edge, transforming how individuals analyze market data, understand sentiment and construct trading strategies.
It’s crucial to understand from the outset: Google Gemini is not a “magic buy/sell button.” Instead, it acts as an intelligent assistant, augmenting your research and analysis capabilities, freeing you from manual data sifting and reducing emotional biases that often plague human traders.
Here’s how you can leverage Google Gemini for smarter crypto trading.
Please note that all prompts and examples discussed in this article were tested using Gemini Flash 2.5, which does not have access to real-time data and reflects insights based on its training as of early 2024. You should always cross-check with current market conditions and data sources before acting on any AI-generated output.
1. Pre-trade research and due diligence
Before entering any trade, understanding what you’re investing in is critical. Gemini can help by summarizing complex project details, comparing competitors and assessing regulatory risks, all in plain language.
Understand token fundamentals
Before entering any trade, understanding what you’re investing in is critical. Gemini can help by summarizing complex project details, comparing competitors and assessing regulatory risks, all in plain language.
Understand token fundamentals
Instead of manually reading lengthy white papers, use Gemini to break down the core elements of a cryptocurrency, its purpose, supply structure, governance model and any warning signs.
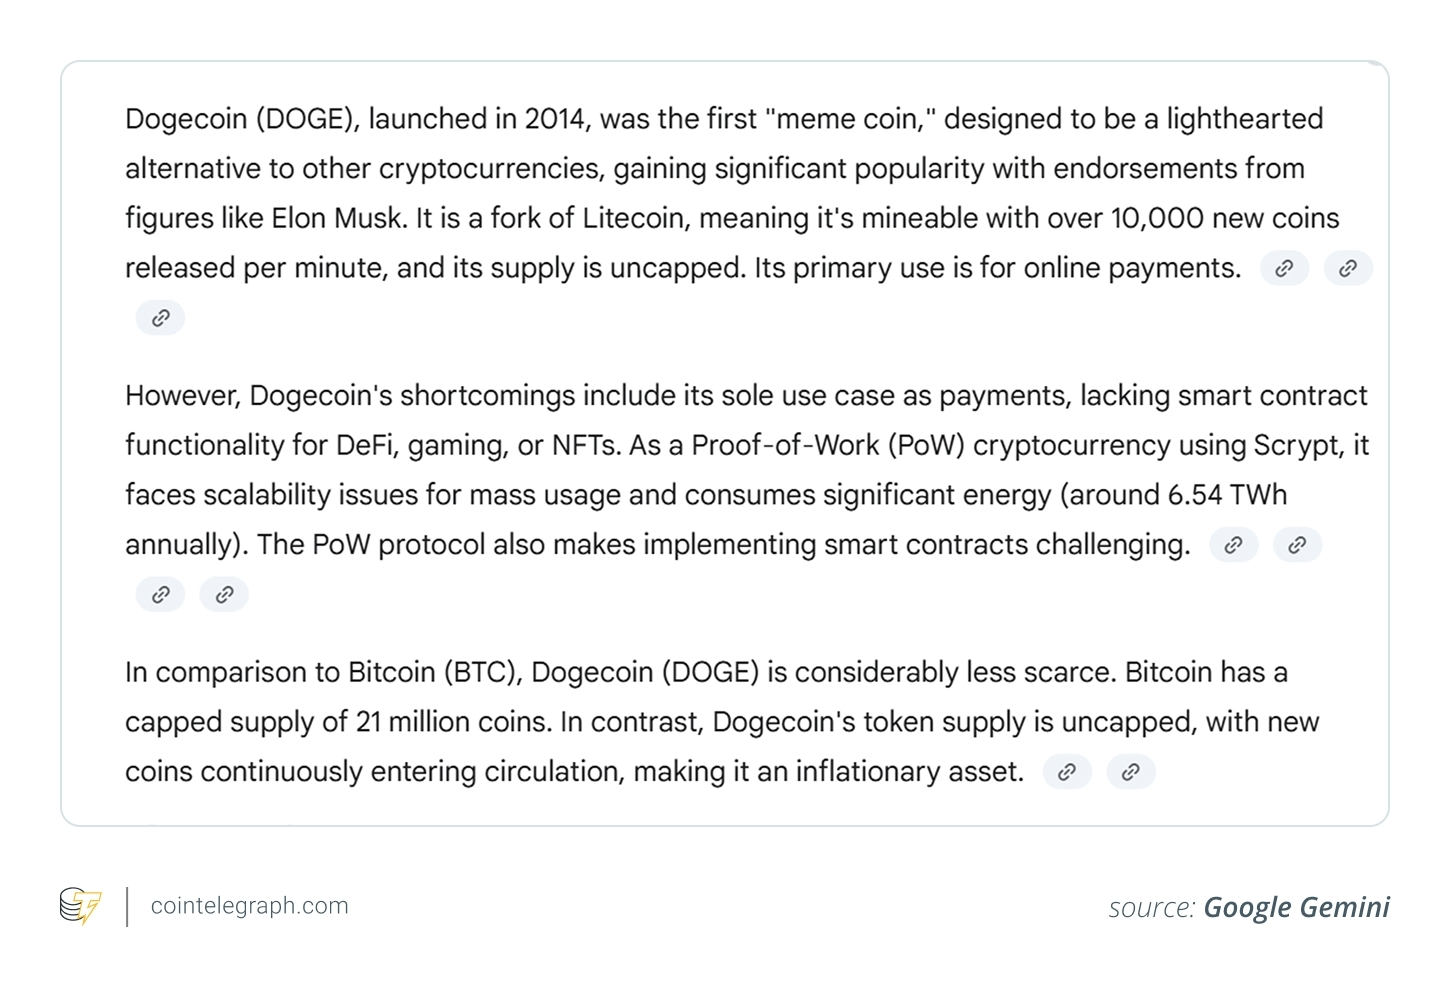
Example prompt: “Summarize the white paper of Dogecoin . Explain how scarce DOGE is in comparison to Bitcoin.”
In response, Gemini describes Dogecoin as a memecoin used mainly for payments, with an uncapped supply and over 10,000 coins minted per minute. It lacks smart contract features, faces energy and scalability issues due to PoW and is inflationary compared to Bitcoin
, which has a fixed supply of 21 million coins.
Compare similar projects
When choosing between two competing assets, Gemini can analyze factors like tech innovation, developer activity and market positioning.
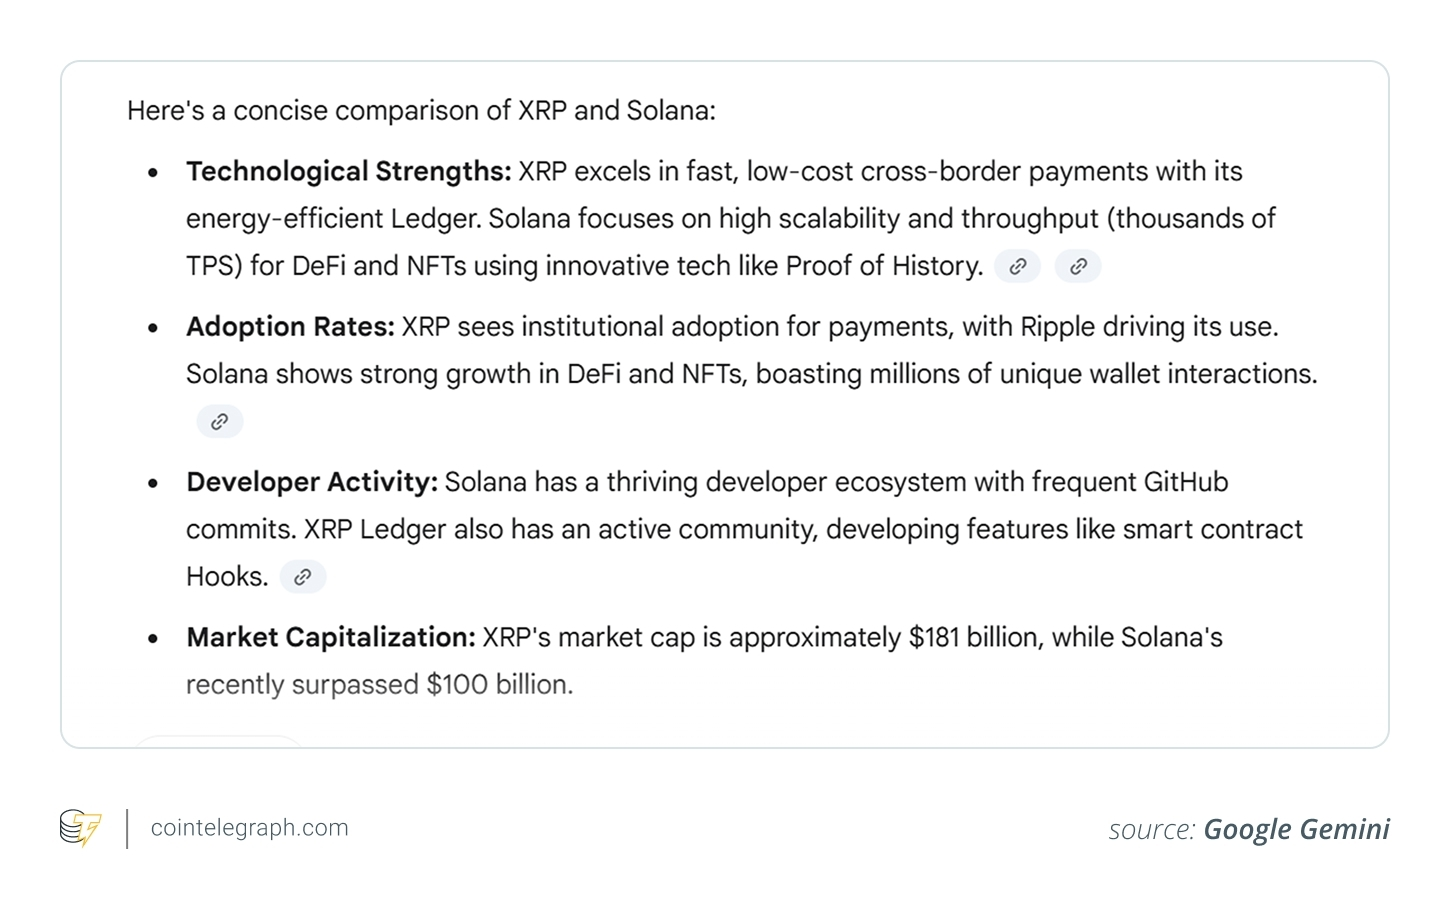
Example prompt: “Compare XRP and Solana based on their technological strengths, adoption rates, developer activity (e.g.,GitHub commits) and market capitalization.”!
Gemini compares XRP and Solana across four dimensions: XRP focuses on fast, low-cost payments and is used mainly by institutions. Solana emphasizes high-throughput performance for DeFi and NFTs. Developer activity is higher on Solana, while XRP is working on smart contract functionality. However, the market cap data provided by Gemini appears outdated and should be independently verified.
Did you know? Google Gemini is built on a unified multimodal architecture, meaning it was designed from the ground up to process text, code, images, audio and video, unlike models like ChatGPT, which added multimodal capabilities later.
2. Entry and exit timing using sentiment assessment
Beyond fundamentals, market psychology plays a huge role in short-term price moves. Gemini can analyze sentiment from social media, simulate potential news impacts and contextualize popular indicators.
Gauge community sentiment
Crypto communities often react quickly to upcoming events. Gemini can help you determine whether sentiment is bullish, bearish or divided.
Example prompt: “Analyze social media sentiment surrounding the Pi Coin. Is the community generally optimistic or cautious?”
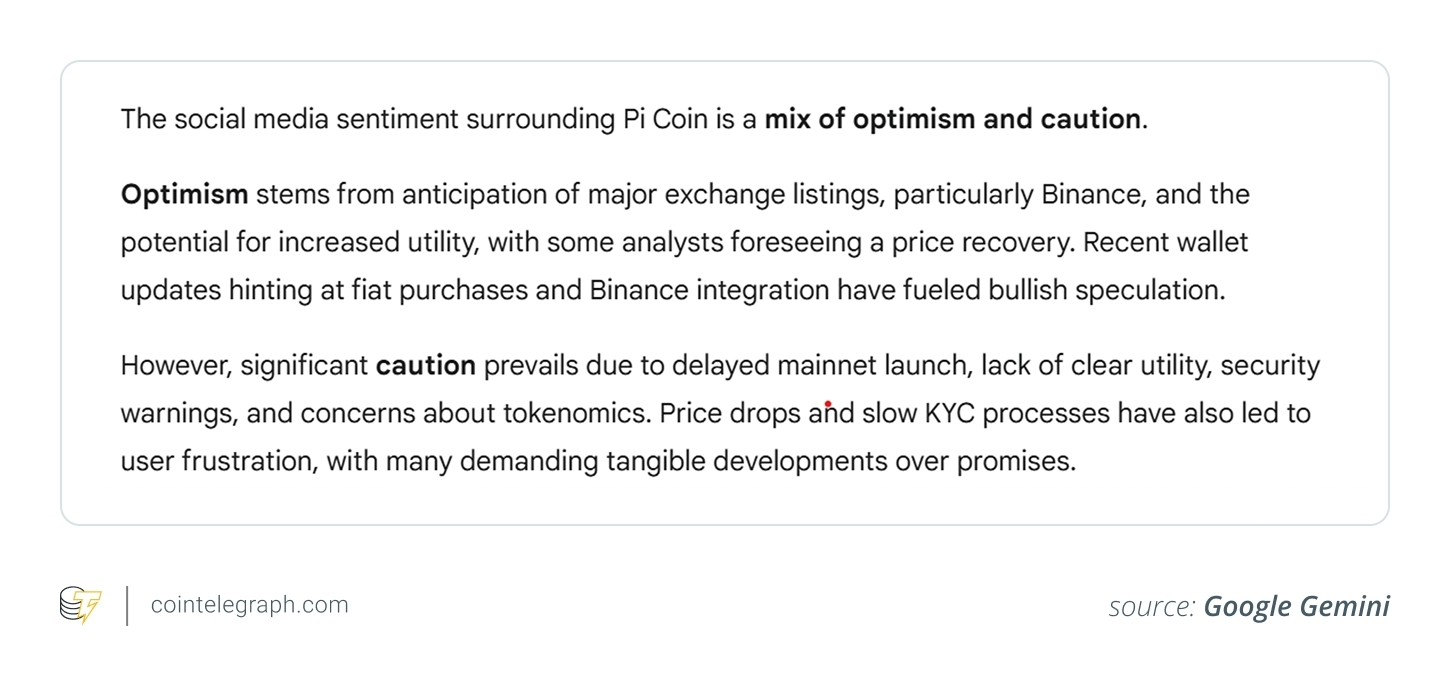
Gemini’s response to the above prompt about Pi Coin’s social media sentiment is partially inaccurate. While it correctly identifies a mix of optimism and caution within the community, it inaccurately claims that Pi Coin’s mainnet launch has been delayed.
In reality, the mainnet officially launched in February 2025. This outdated reference suggests the Gemini 2.5 Flash model may have generated its answer from static or pre-mainnet data. Furthermore, the response overlooks key post-launch issues that are currently driving caution, such as token withdrawal restrictions, lack of major exchange listings, KYC delays and confusion around token migration.
Although the general sentiment tone, hopeful yet skeptical, is valid, the explanation lacks up-to-date context. This highlights the importance of cross-verifying AI-generated insights with current developments when evaluating evolving crypto projects like Pi Coin.
3. Strategy development: Testing ideas with context
Whether you’re creating new strategies or tweaking old ones, Gemini can assist with conceptual analysis, pattern explanations and identifying market correlations.
Explore market correlations
Understanding how Bitcoin interacts with traditional markets can improve timing and asset selection. Gemini helps identify leading indicators and lagging trends.
Example prompt: “Is there a historical correlation between the S&P 500 and Bitcoin? What indicators suggest one leads the other?”
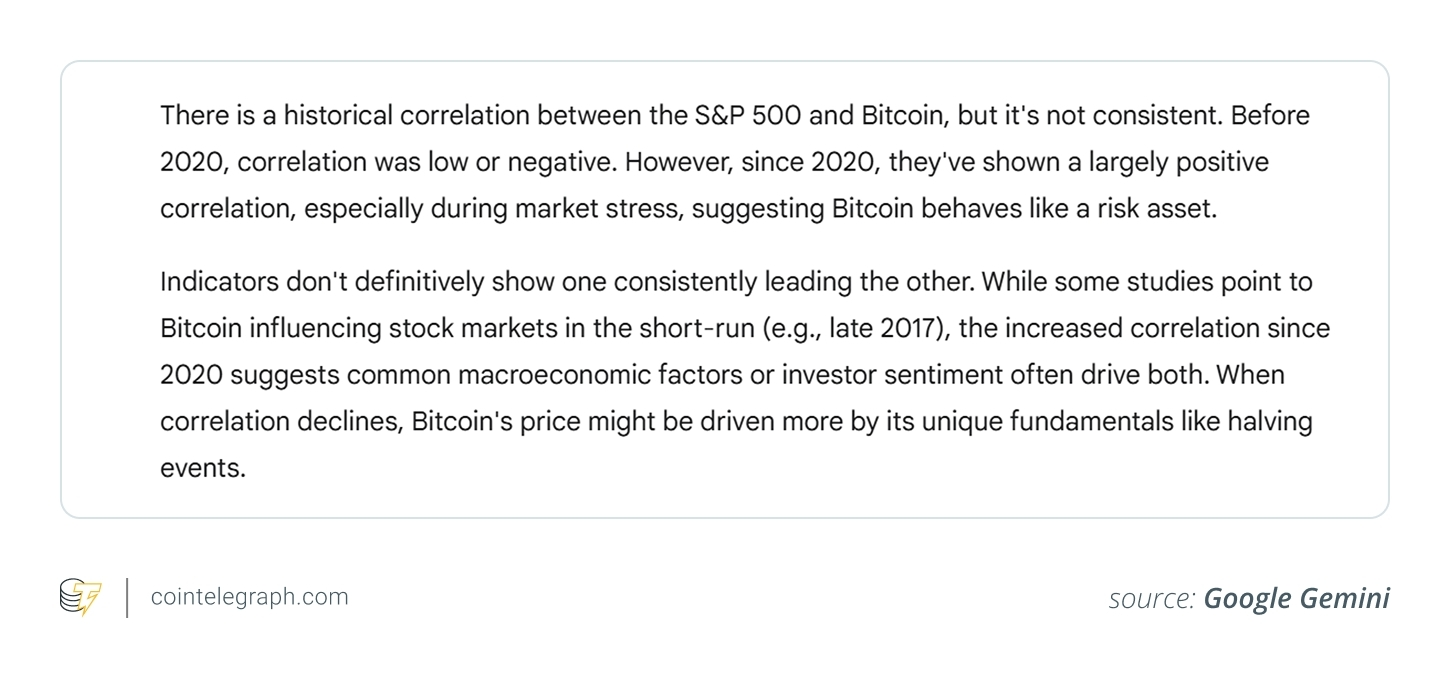
Gemini’s response on the historical correlation between Bitcoin and the S&P 500 is broadly accurate but lacks up-to-date specificity. It correctly states that the correlation was low or even negative before 2020 and became more positive in the years following, especially during times of market stress. This reflects the broader trend of Bitcoin behaving more like a risk asset as institutional adoption grew.
According to a CME Group analysis, since 2020, Bitcoin and major stock indices have been influenced by similar macroeconomic factors, such as interest rate policy, inflation expectations and overall risk sentiment.
Recent data further confirms this trend.
In early 2025, the 30-day correlation between Bitcoin and the S&P 500 rebounded sharply, reaching 0.87 during periods of heightened market stress, as reported by Reuters.
Historically, this correlation has fluctuated in the 0.3–0.5 range but tends to spike above 0.7 during significant market sell-offs. A live chart from NewHedge.io visually supports these patterns, showing periods of strong positive correlation in recent quarters.
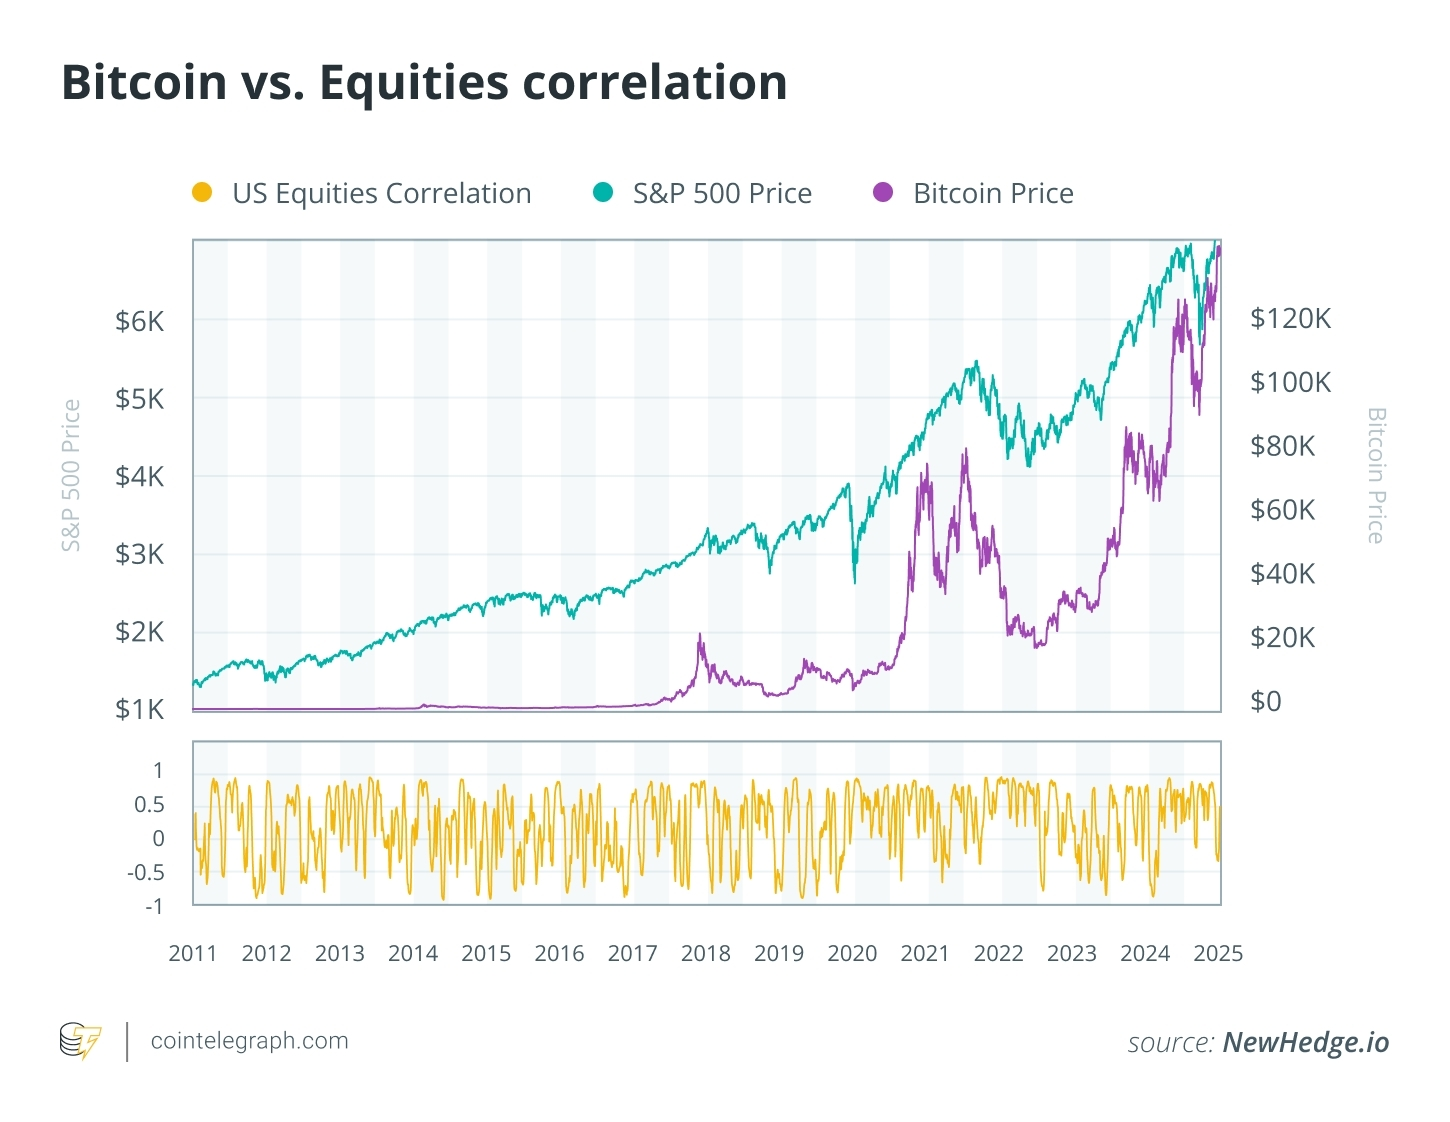
While Gemini accurately captures the general shift in behavior and acknowledges that neither asset consistently leads the other, it doesn’t reflect the current intensity of the correlation or the real-time macro context. For instance, during the Q1 2025 downturn, both Bitcoin and US equities reacted simultaneously to Fed policy concerns and geopolitical risk tensions.
Although Gemini offers relevant insights grounded in current market signals and your historical trade behavior, conditions can shift rapidly. Traders should not rely solely on historical analogs or AI-generated signals and must continuously assess risk, confirm entries and use disciplined position management.
Did you know? Gemini Flash (like 2.5) is a lightweight, faster variant optimized for responsiveness, while Gemini Pro and Ultra focus on more complex tasks. It competes with OpenAI’s ChatGPT-4 Turbo in terms of reasoning, speed and tool integration.
What Google Gemini can’t do in crypto trading
While Gemini is a powerful AI assistant, it’s important to understand its limitations to avoid misplaced trust or over-reliance.
It doesn’t:
- Predict prices: Gemini can analyze past trends and simulate scenarios, but it doesn’t “know” the future. Any interpretation of potential price movements is speculative and should not be treated as a forecast.
- Access real-time onchain data: At the moment, Gemini doesn’t connect directly to blockchains or APIs for live data. For current prices, wallet flows, gas fees or protocol activity, you still need tools like CoinGecko, DefiLlama or Nansen.
- Replace technical tools: While it can explain technical indicators or patterns conceptually, it doesn’t do live charting, auto-draw support/resistance lines or generate buy/sell signals. Use it alongside trading platforms like TradingView or CoinMarketCap.
- Understand your portfolio: Gemini doesn’t know your current holdings, risk tolerance, or position sizing unless you explicitly input that data. It can help you think through decisions, but it’s not personalized unless you make it so.
When to use AI and when to be skeptical
Understanding AI’s strengths and blind spots is essential for safe and effective use, enforcing the idea that shared macro triggers often drive both markets in tandem.
Therefore, while Gemini’s explanation is directionally correct, it omits the latest data points necessary for time-sensitive analysis and should be supplemented with live market tracking tools and updated research.
Learn technical patterns
Gemini can explain how common patterns like head-and-shoulders or double tops behave in crypto’s high-volatility environment.
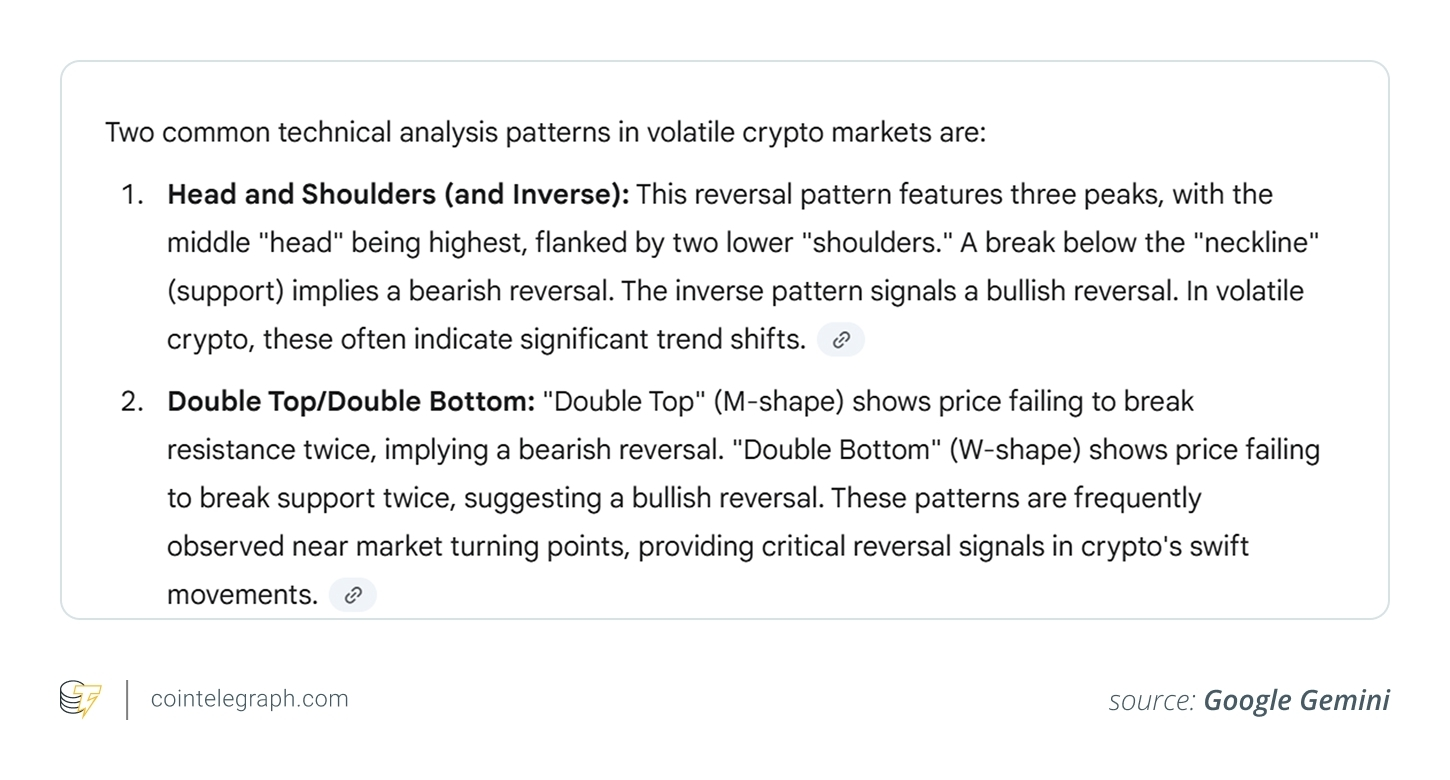
Example prompt: “Describe two common technical analysis patterns and explain their typical implications in volatile crypto markets.”
Gemini explains that head-and shoulders patterns signal trend reversals, bearish or bullish depending on the formation. Double top/bottom patterns also indicate potential reversals, with price failing to break resistance or support, common in volatile crypto markets.
Did you know? Compared to Elon Musk’s Grok (developed by xAI), Gemini is tightly integrated with Google Search, Docs and other Google services, offering deep contextual integration for productivity, whereas Grok emphasizes real-time X data.
4. Risk management: Building a resilient portfolio
Risk management isn’t just about setting stop-losses. Gemini can help you diversify smarter and plan for extreme market scenarios.
Find low-correlation assets
Reducing portfolio risk means not putting all your eggs in one (Bitcoin) basket. Gemini can help identify altcoins with low historical correlation.
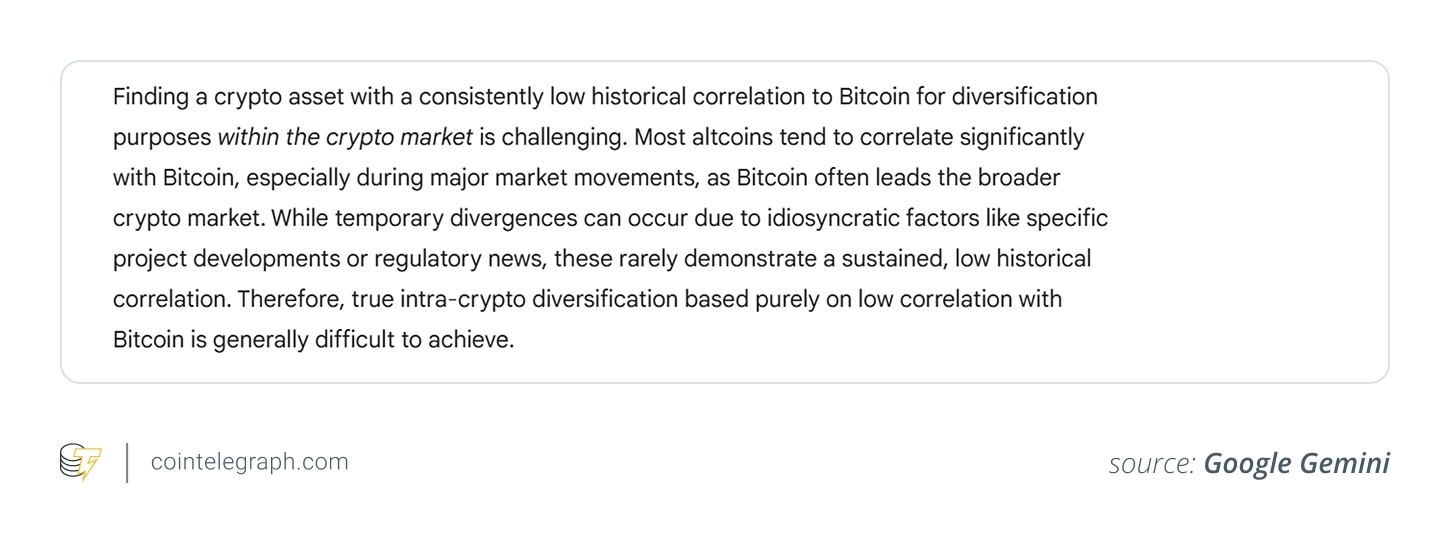
Example prompt: “Suggest one crypto asset that historically has a low correlation with Bitcoin, for diversification purposes.”
According to the response below, Gemini does not directly answer the prompt, which asks for one crypto asset with historically low correlation to Bitcoin. Instead, it explains why such assets are rare, stating that most altcoins tend to move with Bitcoin, especially during market-wide events. While informative, the response fails to provide a specific asset, as requested.
5. Trade reflections: learning from the past
The best traders review their wins and losses. Gemini can analyze what the market looked like during your past trades and explain unusual price action.
Analyze past trades
Get a clearer picture of the market conditions around a trade. Gemini can point out news, sentiment, or technical signals you might have missed.
Sample past trade
- Asset:EtherETH$4,377
- Trade: Bought at $1,500 on March 10, 2021
- Sold at: $1,800 on March 20, 2021
- Outcome: Profit of $300
- Context: You sold after a rally, but missed a bigger run-up days later.
Suppose now, you’re considering buying ETH again, and the setup looks similar.Let Gemini compare past market conditions wittoday’s's spot patterns, and help you think critically about timing, risk and entry signals.
Example prompt: “I’m planning to enter a new ETH position this week. Based on my past ETH trade from March 2021, are there similar market signals now in terms of momentum, sentiment or macro news? What lessons from that trade could help improve my timing this time?”
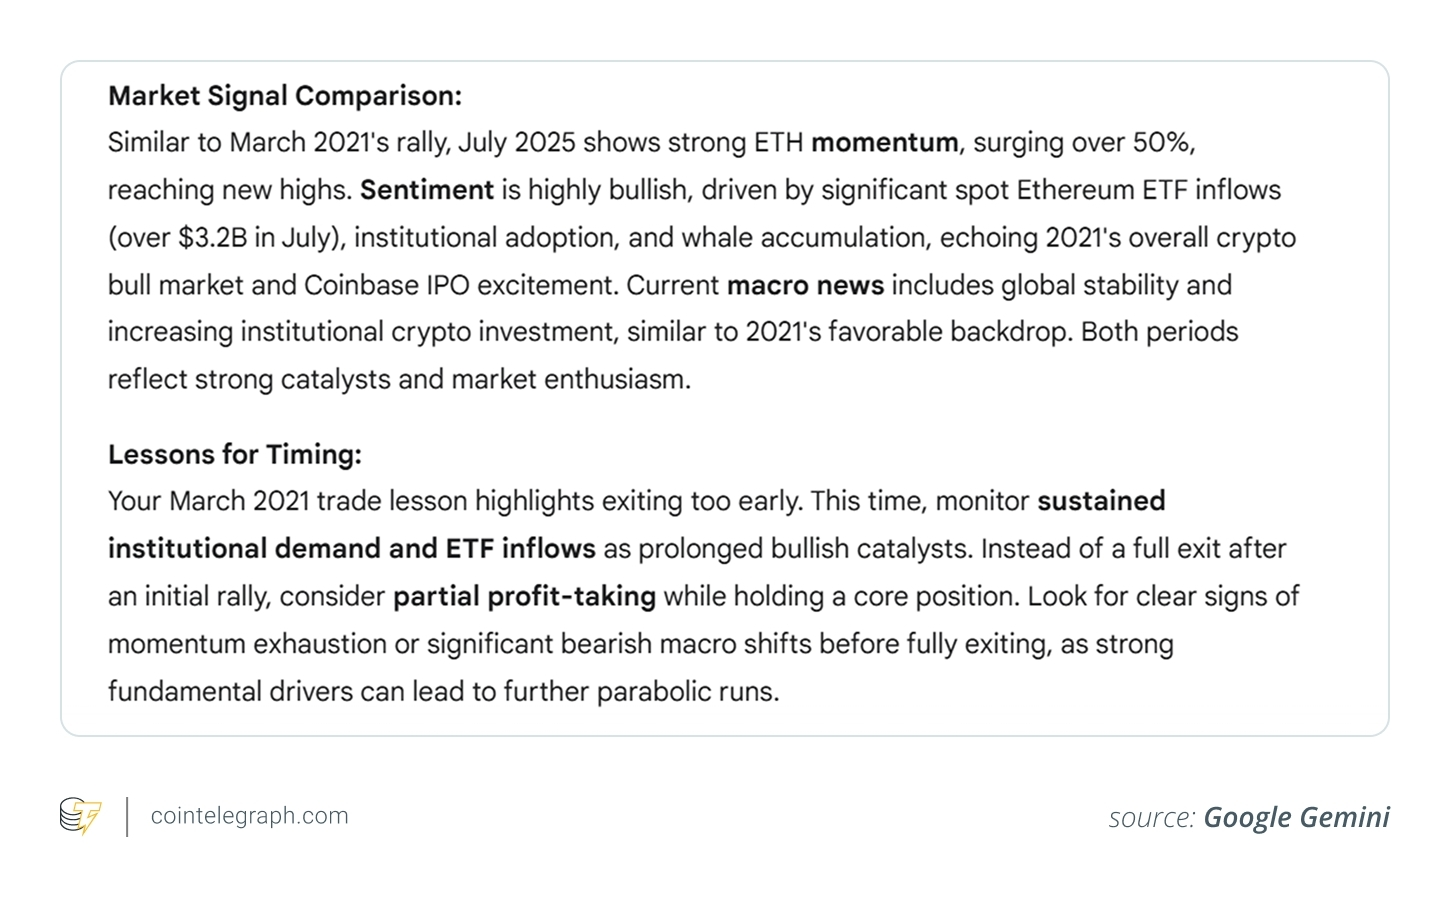
Gemini’s response below does a strong job of comparing March 2021 ETH trade with the July 2025 market environment. It identifies similar bullish drivers such as strong momentum (+50% surge), ETF inflows ($3.2 billion in July), institutional demand, and macro stability, mirroring the backdrop from 2021.
The analysis suggests that a trader’s previous early exit likely missed a larger run and recommends a more nuanced approach this time: Monitor sustained demand, consider partial profit-taking rather than a full exit, and wait for signs of momentum exhaustion or macro deterioration.
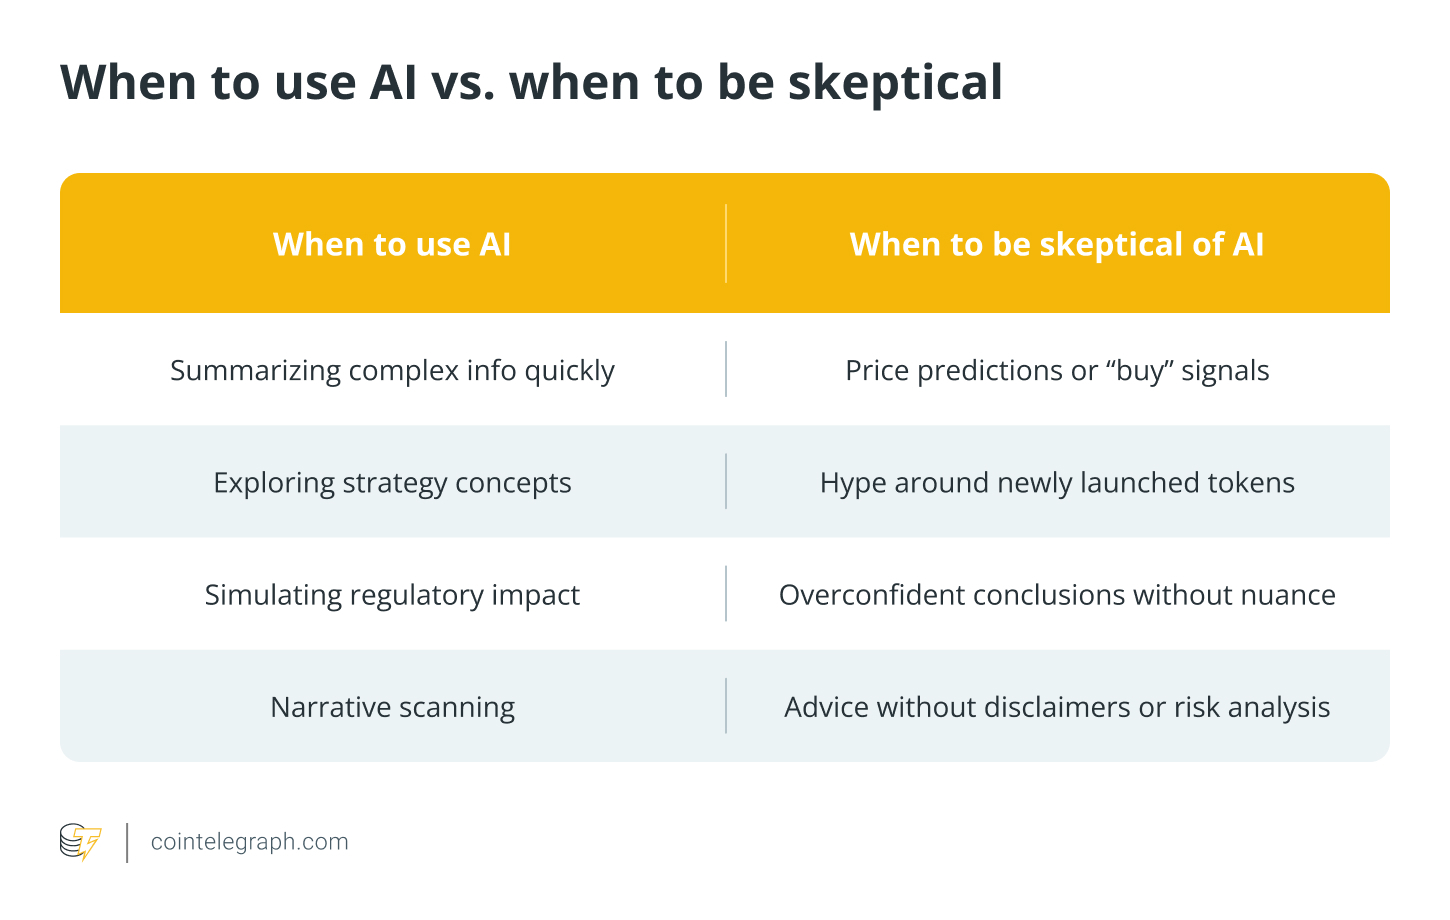
When something feels off, dig deeper. AI can reflect biases in training data or fail to catch recent changes in market dynamics. Always remember that no AI model truly “understands” financial markets. It doesn’t trade itself, manage capital or feel the consequences of a bad decision — you do.
To maximize your edge, pair Gemini with tools like:
- Market data and charting: TradingView, CoinMarketCap, CoinGecko
- Onchain analytics: Nansen, Glassnode, Dune Analytics
- Portfolio trackers: Zapper, DeBank, Zerion
- News and alerts: Token Terminal, CryptoPanic, Messari
- Social and sentiment: LunarCrush, Santiment, X, Reddit
Use Gemini to interpret, synthesize or simulate insights from what these tools give you.
Don’t forget that in crypto, curiosity and caution should always go hand in hand.


All Comments