


From CryptoVizArt, UkuriaOC, Glassnode
Executive Summary
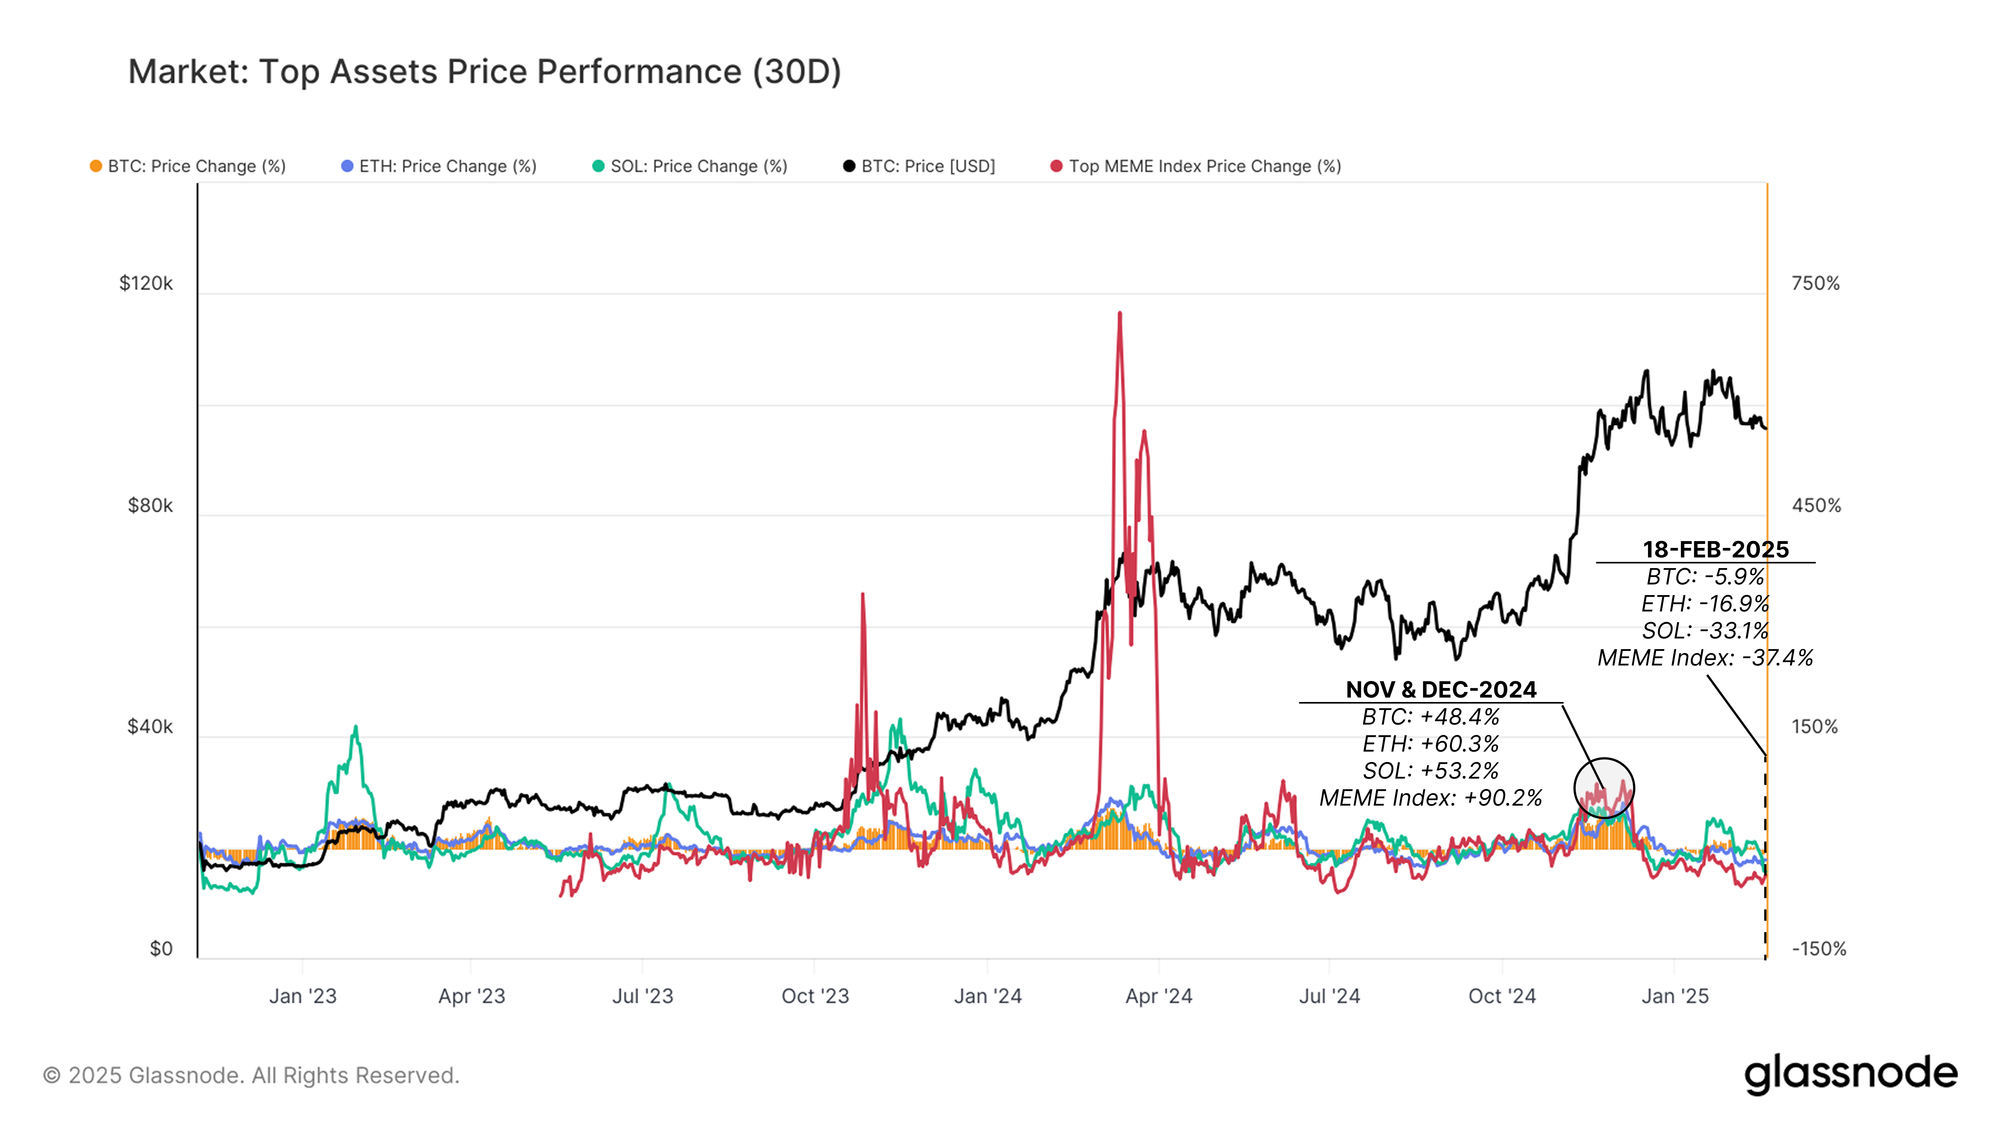
- After Bitcoin’s second attempt to break above $105k in late January, the market has entered a contraction phase, with monthly price momentum sharply declining across major assets.
- Bitcoin has held relatively steady, while Ethereum, Solana, and Memecoins have faced much deeper corrections, reflecting a shifting appetite for risk.
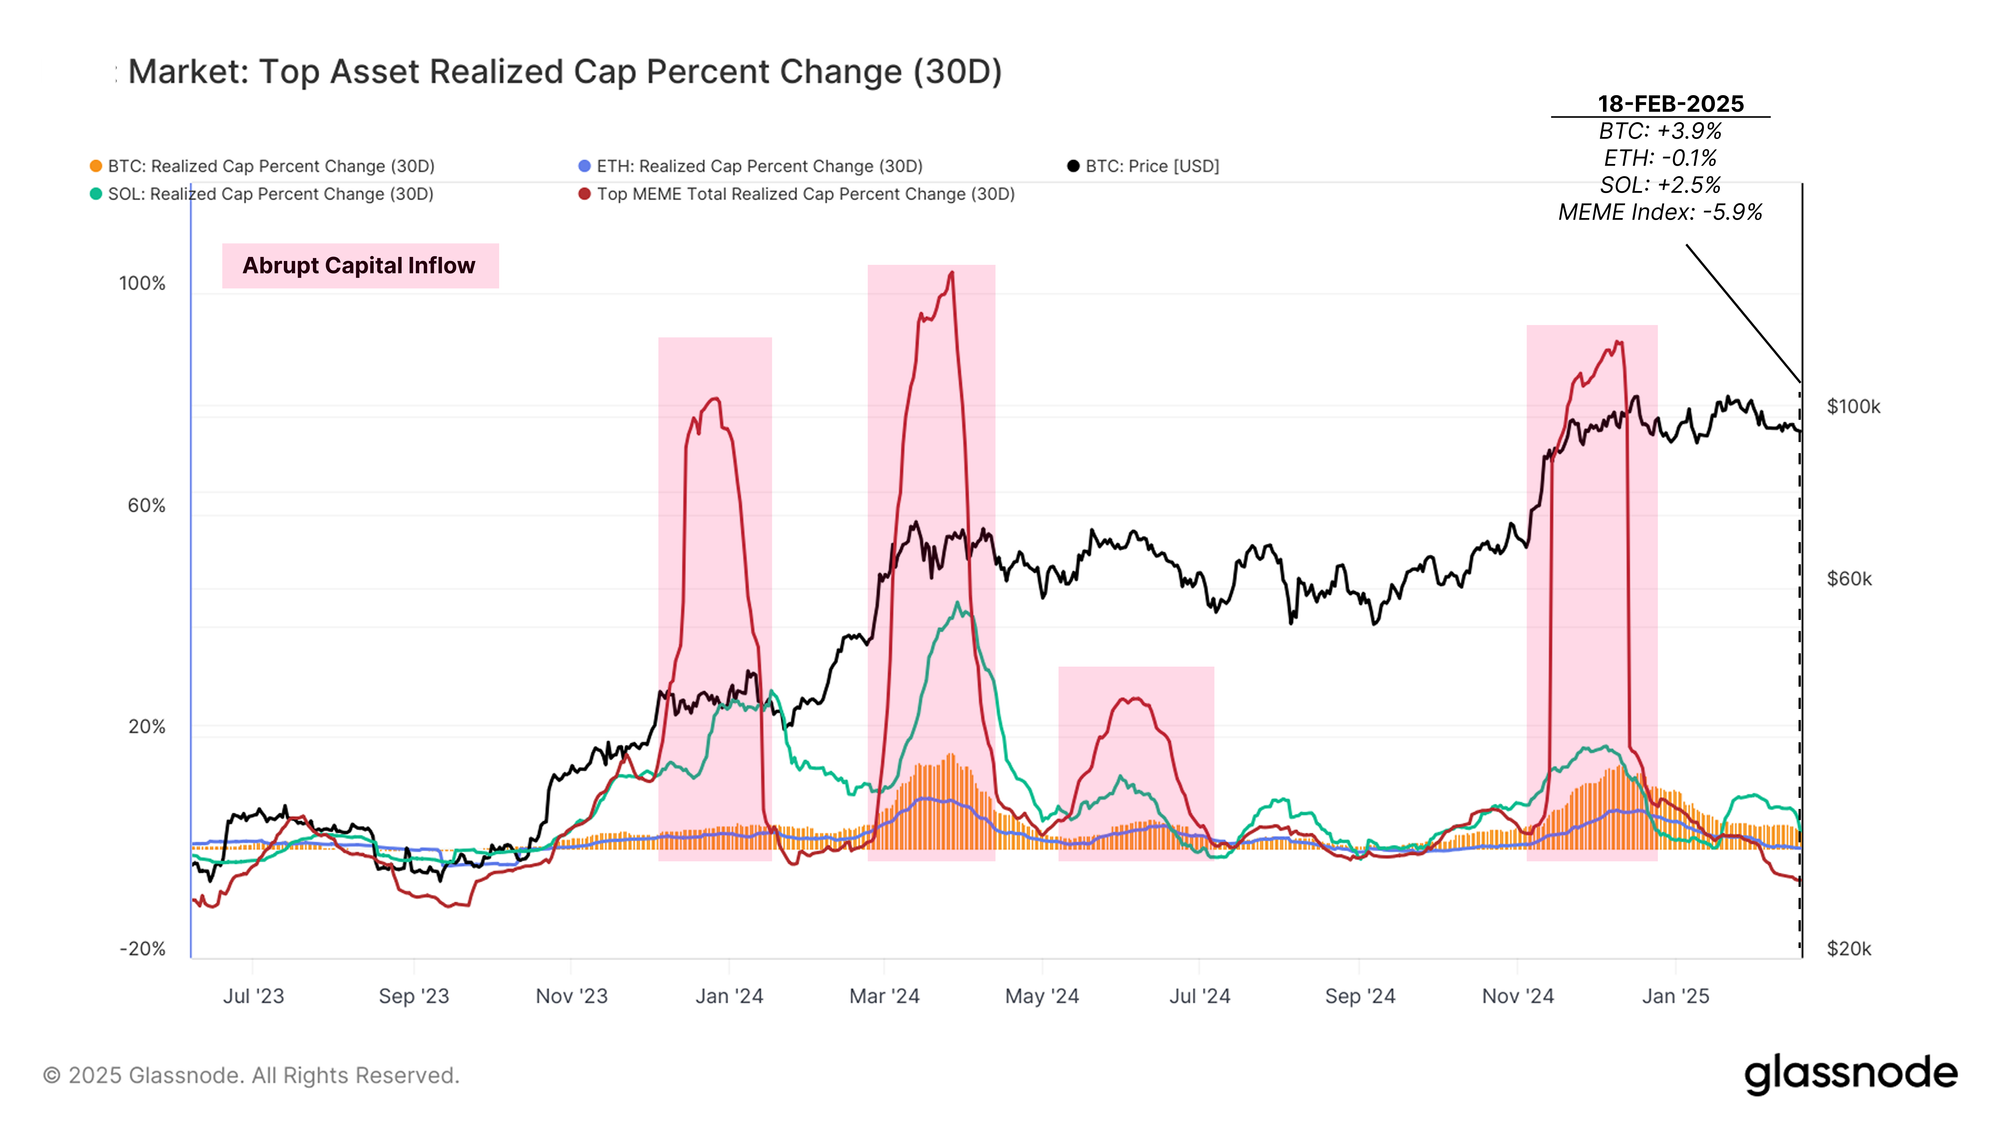
- Solana has emerged as a market leader in capital inflows over the past two years, in contrast to Ethereum, which has comparatively struggled to attract sustained demand.
- However, this week, all digital assets aside from Bitcoin have seen a dramatic decline in capital flows, with Solana, and its associated memecoin ecosystem taking a relatively large hit.
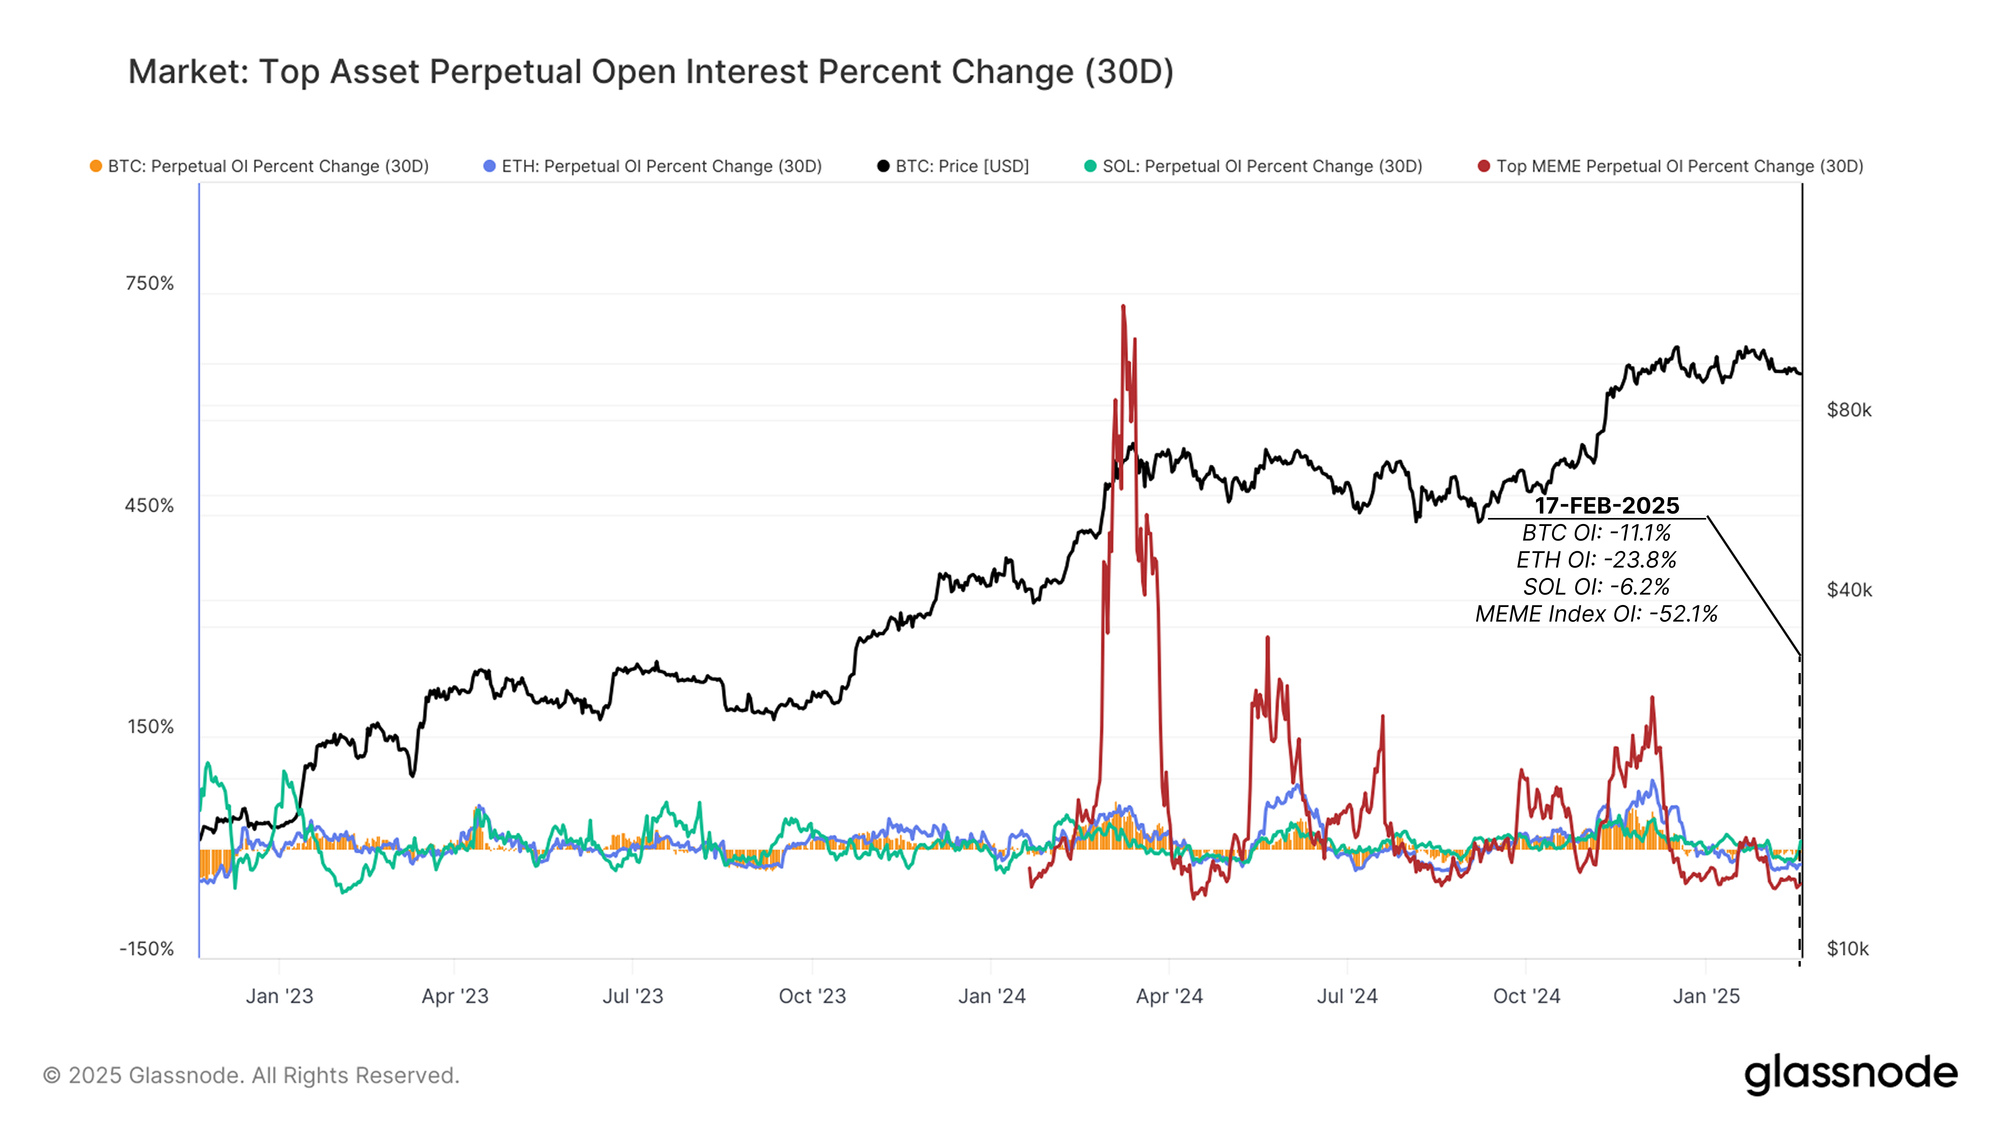
- Perpetual futures open interest has declined across Bitcoin (-11.1%), Ethereum (-23.8%), Solana (-6.2%), and Memecoins Index (-52.1%), reflecting a diminished appetite for leveraged speculation.
💡View all charts in this edition in The Week On-chain Dashboard.
Market Momentum Takes a Breather
The Bitcoin market attempted to rally above the ATH, and back into price discovery in late January 2025. This rally, however, could not achieve the necessary momentum, and the market has entered into a period of contraction and consolidation since then, with price momentum sharply declining across major assets.
- Bitcoin: +48.4% (Nov 2024) → -5.9% (Feb 2025)
- Ethereum: +60.3% (Dec 2024) → -16.9% (Feb 2025)
- Solana: +53.2% (Nov 2024) → -33.1% (Feb 2025)
- Meme Coins Index: +90.2% (Dec 2024) → -37.4% (Feb 2025)
Notably, Memecoins and Solana have thrived during strongly trending market conditions but also tend to correct sharply during downturns. Ethereum has remained one of the weakest performers throughout this cycle, and whilst it has outperformed Solana this week, a robust trend of out-performance has not yet been established.
Assessing Performance So Far
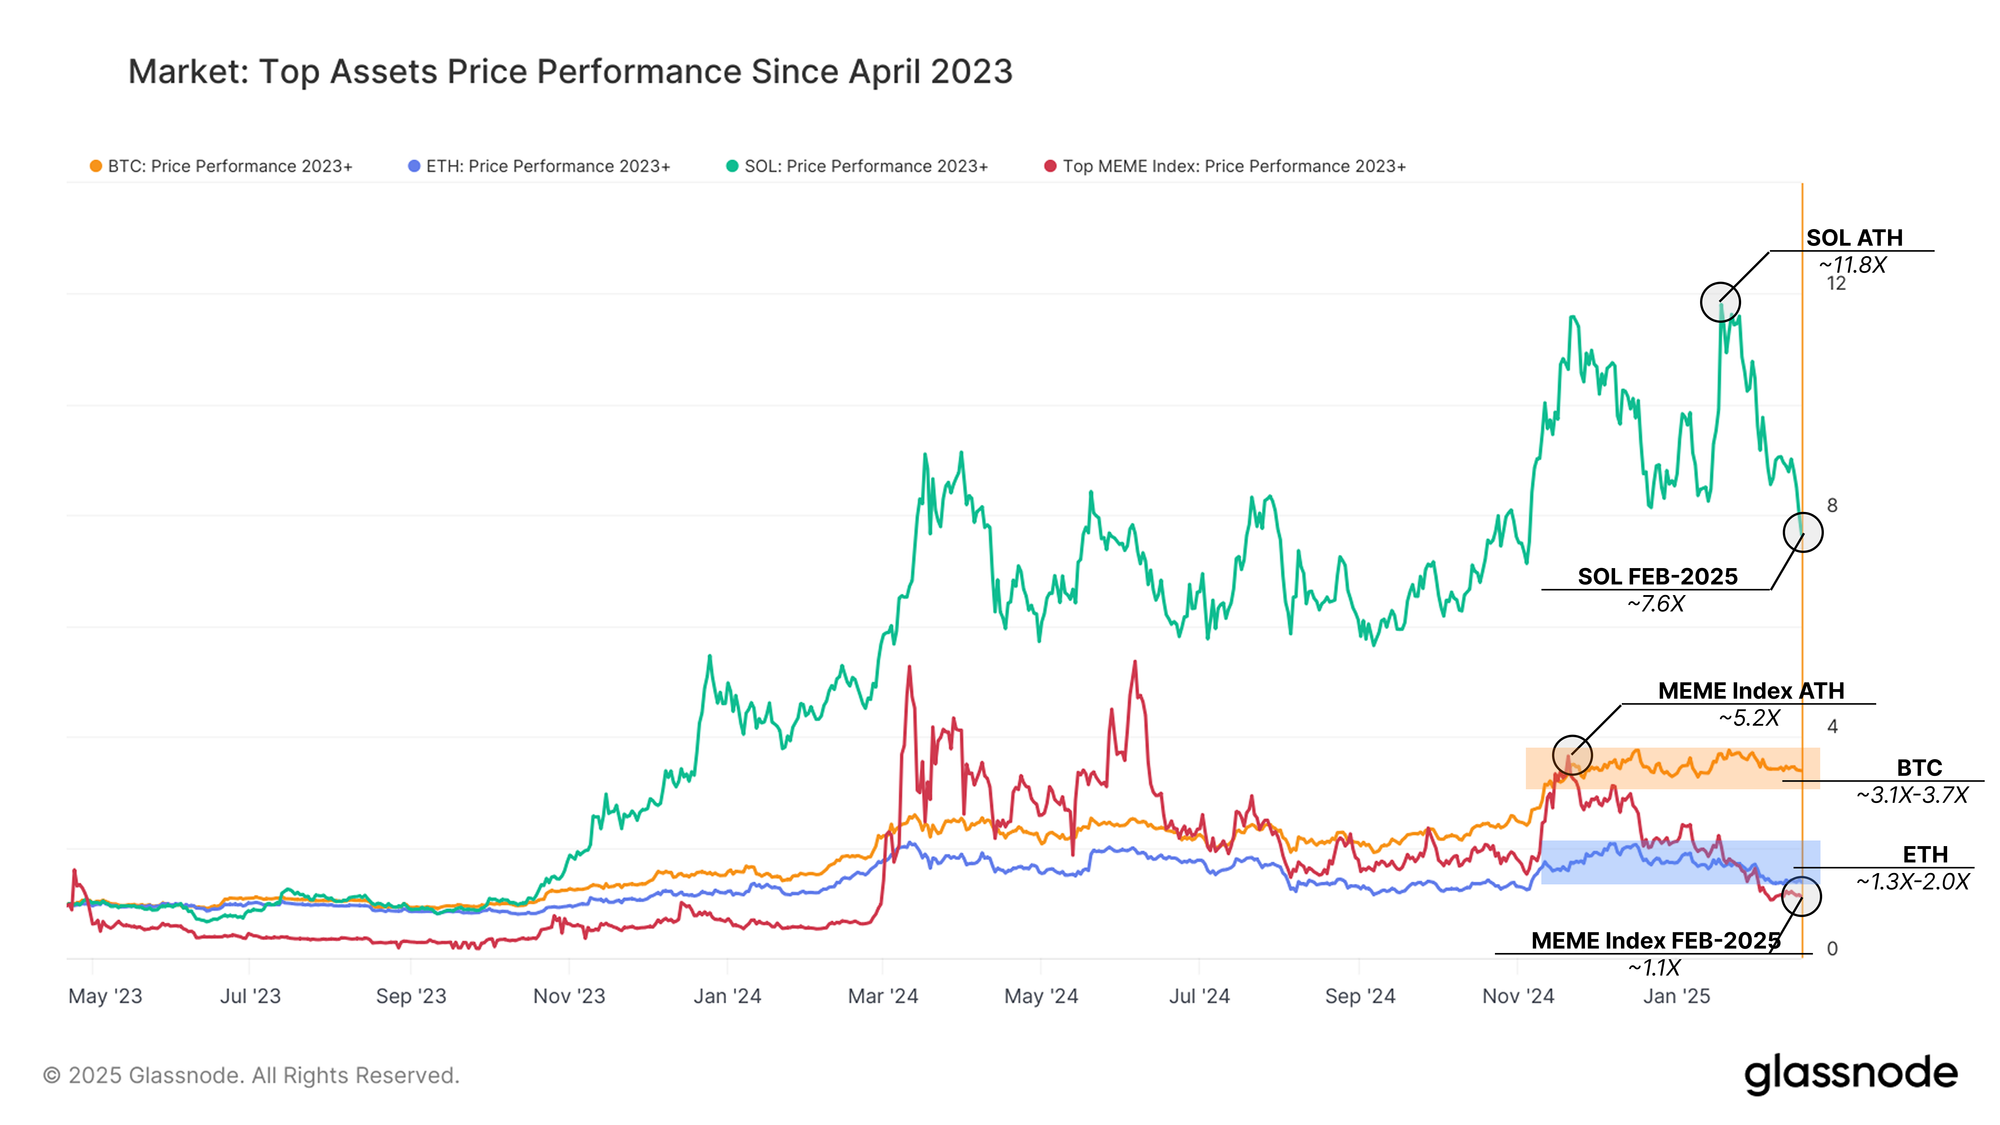
The recent slowdown comes after an extended period of strong gains across the major digital assets. Looking at the performance since early 2023, we can see clear differentiation in how each asset has navigated the cycle so far:
- Bitcoin is trading within a range approximately 3.4x higher than April 2023, providing a benchmark return profile.
- Ethereum has struggled compared to its peers, ranging between 1.3X and 2.0X relative to April 2023.
- Solana's returns since 2023 peaked at 11.8x in early January 2025, but have since dropped sharply to around 7.6x as the current correction took hold.
- Memecoins Index: Saw an explosive uptick in prices in mid-2024, largely aligned with Solana’s out-performance, and peaking 5.2X since 2023. However, recent weeks have seen this sector get hit quite severely, with total performance now being the worst out of the four assets.
This provides a view of Solana’s high-beta nature, where it has experienced both the strongest upside and also the sharpest corrections. Bitcoin’s steadier trajectory highlights its resilience as a benchmark return profile for the digital asset space. Memecoins, in particular, have seen a marked decline in investor demand of late, suggesting there has been a change in risk appetite.
Capital Flows Drive Markets
The strong out-performance of Solana over the last two years aligns with a persistent capital inflow from investor demand. Looking at the monthly change in the realized cap, we can see clear patterns in capital movement across various digital assets:
- Solana: Has consistently attracted higher relative capital inflows, supporting its strong price appreciation.
- Ethereum: Has seen the weakest capital net inflow out of the majors, explaining its relative underperformance.
- Memecoins: Experienced several abrupt but unsustainable surges in capital inflow, reflecting speculative bursts, but without sustained momentum.
However, in recent weeks, the momentum of capital inflows has declined for all digital assets. Notably, Ethereum and Top Memecoins have now flipped negative (capital outflows), with Ethereum facing a -0.1% net outflow from the Realized Cap and Memecoins Index seeing an even sharper -5.9% outflow.
This signals a meaningful cooling down in speculative appetite and alludes to a potential for capital rotation out of riskier assets on the road ahead.
Weakness In Futures Markets
As momentum starts to fade in spot markets, we can also see a decline in capital inflows within the perpetual futures market. The cooling of demand on the spot side has led to a sharp drop in perpetual open interest (OI) across all major assets, signalling a reduction in speculative activity and lower cash and carry yields.
Over the last 30 days, the rate of change in open interest highlights a widespread retreat of capital:
- Bitcoin OI: -11.1%
- Ethereum OI: -23.8%
- Solana OI: -6.2%
- Memecoins OI: -52.1%
This trend of declining open interest across the board suggests that speculators are reducing their leveraged exposure, likely in response to weaker market momentum and increasing market uncertainty. The most extreme decline is seen in Memecoins, which tend to attract more short-term leveraged bets but lose traction quickly whenever sentiment weakens.
Funding Rates Signal Bearish Sentiment
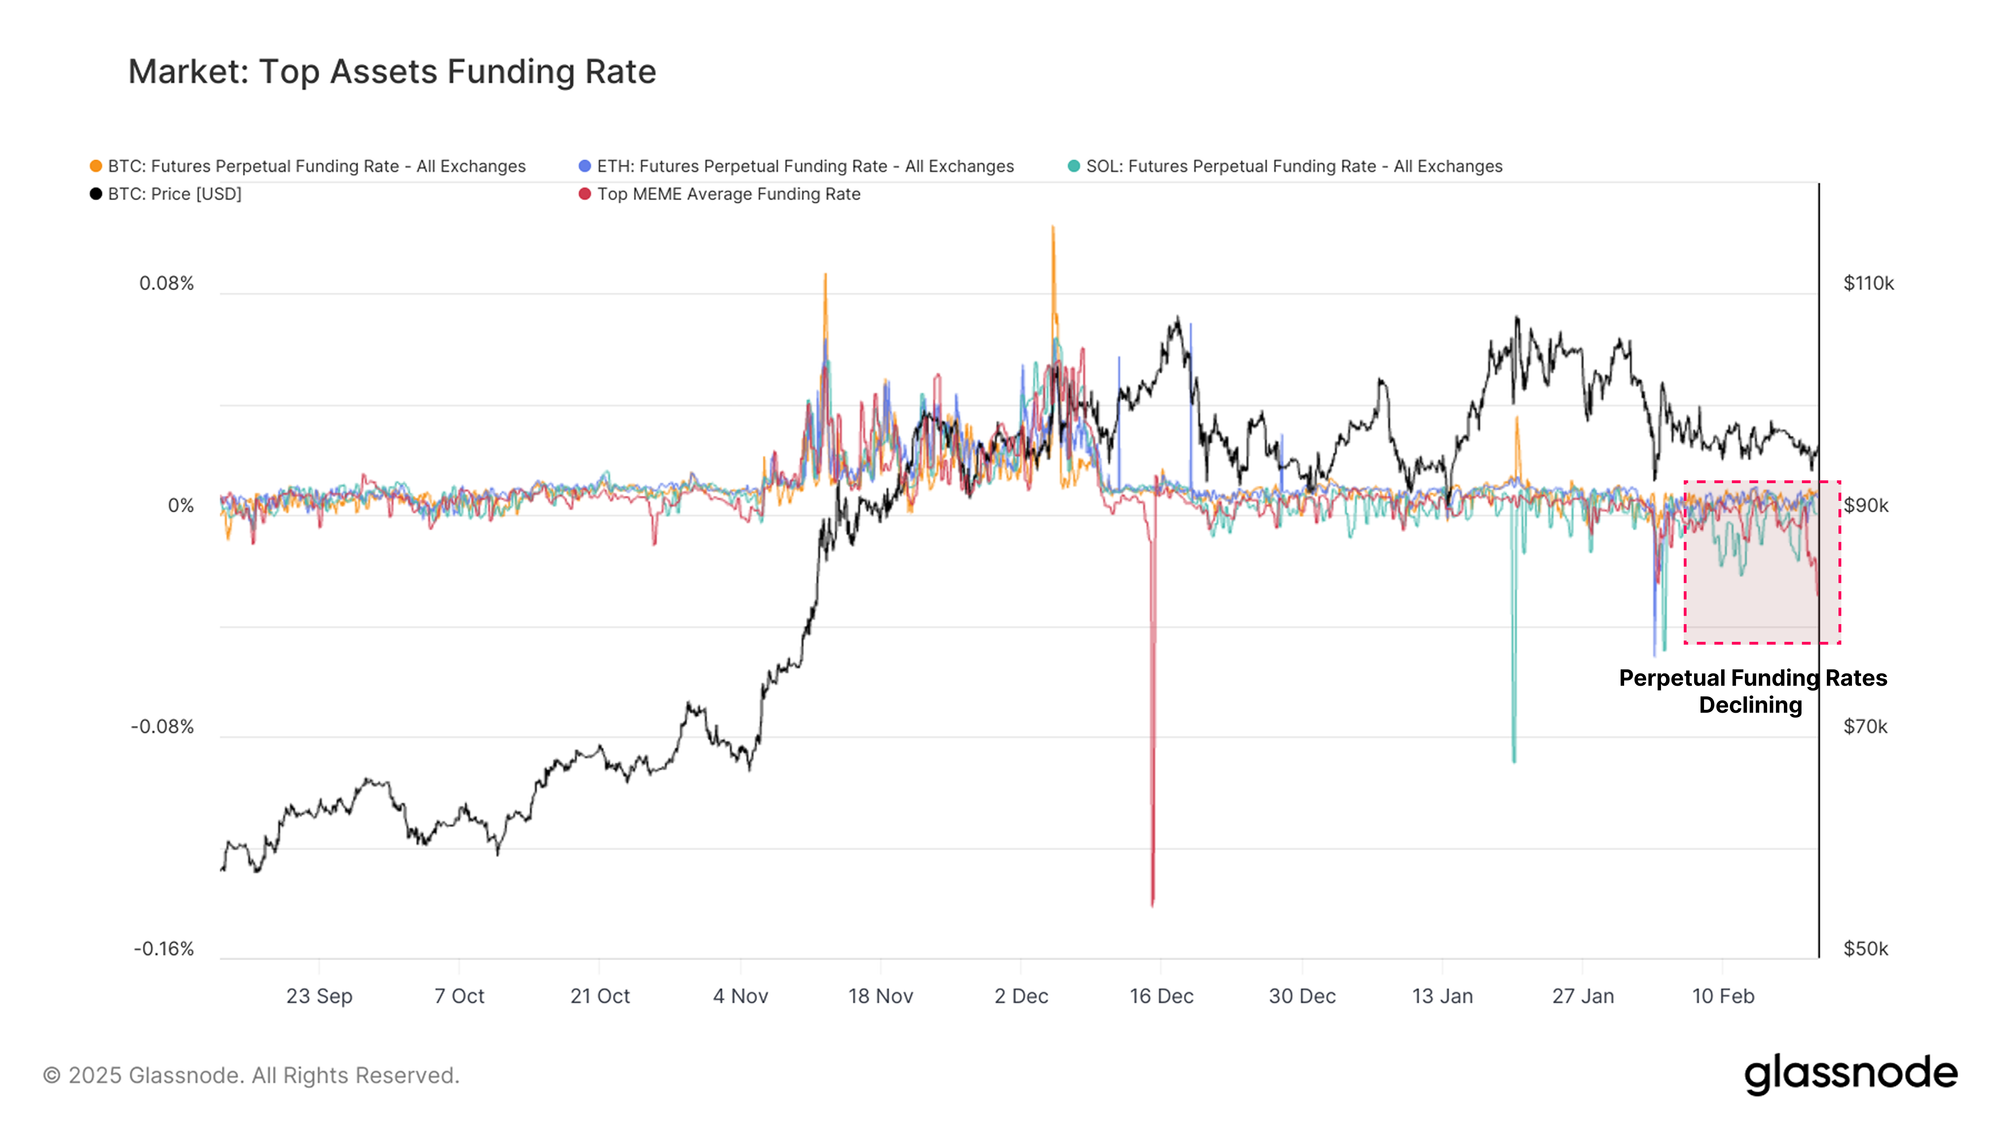
The weakening in open interest is further reinforced by a decline in perpetual futures funding rates. This reflects a shift toward more bearish sentiment and an unwinding of leveraged positions, particularly in riskier assets.
- Bitcoin and Ethereum funding rates remain slightly positive, and their deeper liquidity profile tends to see positive funding rates except during sharp leverage wash-out events.
- Solana funding rate have edged lower and have traded negative in recent weeks, signalling a cooling off of demand for long speculative positions.
- Memecoins have seen funding rates turn very negative, indicating that shorts now dominate in these highly speculative assets, and many traders are closing their positions (or being liquidated).
Negative funding rates for Solana and Memecoins suggest a net shift towards bearish sentiment in higher-risk assets and a closing out of excessive long-sided leverage.
ETF Flows and Market Impact
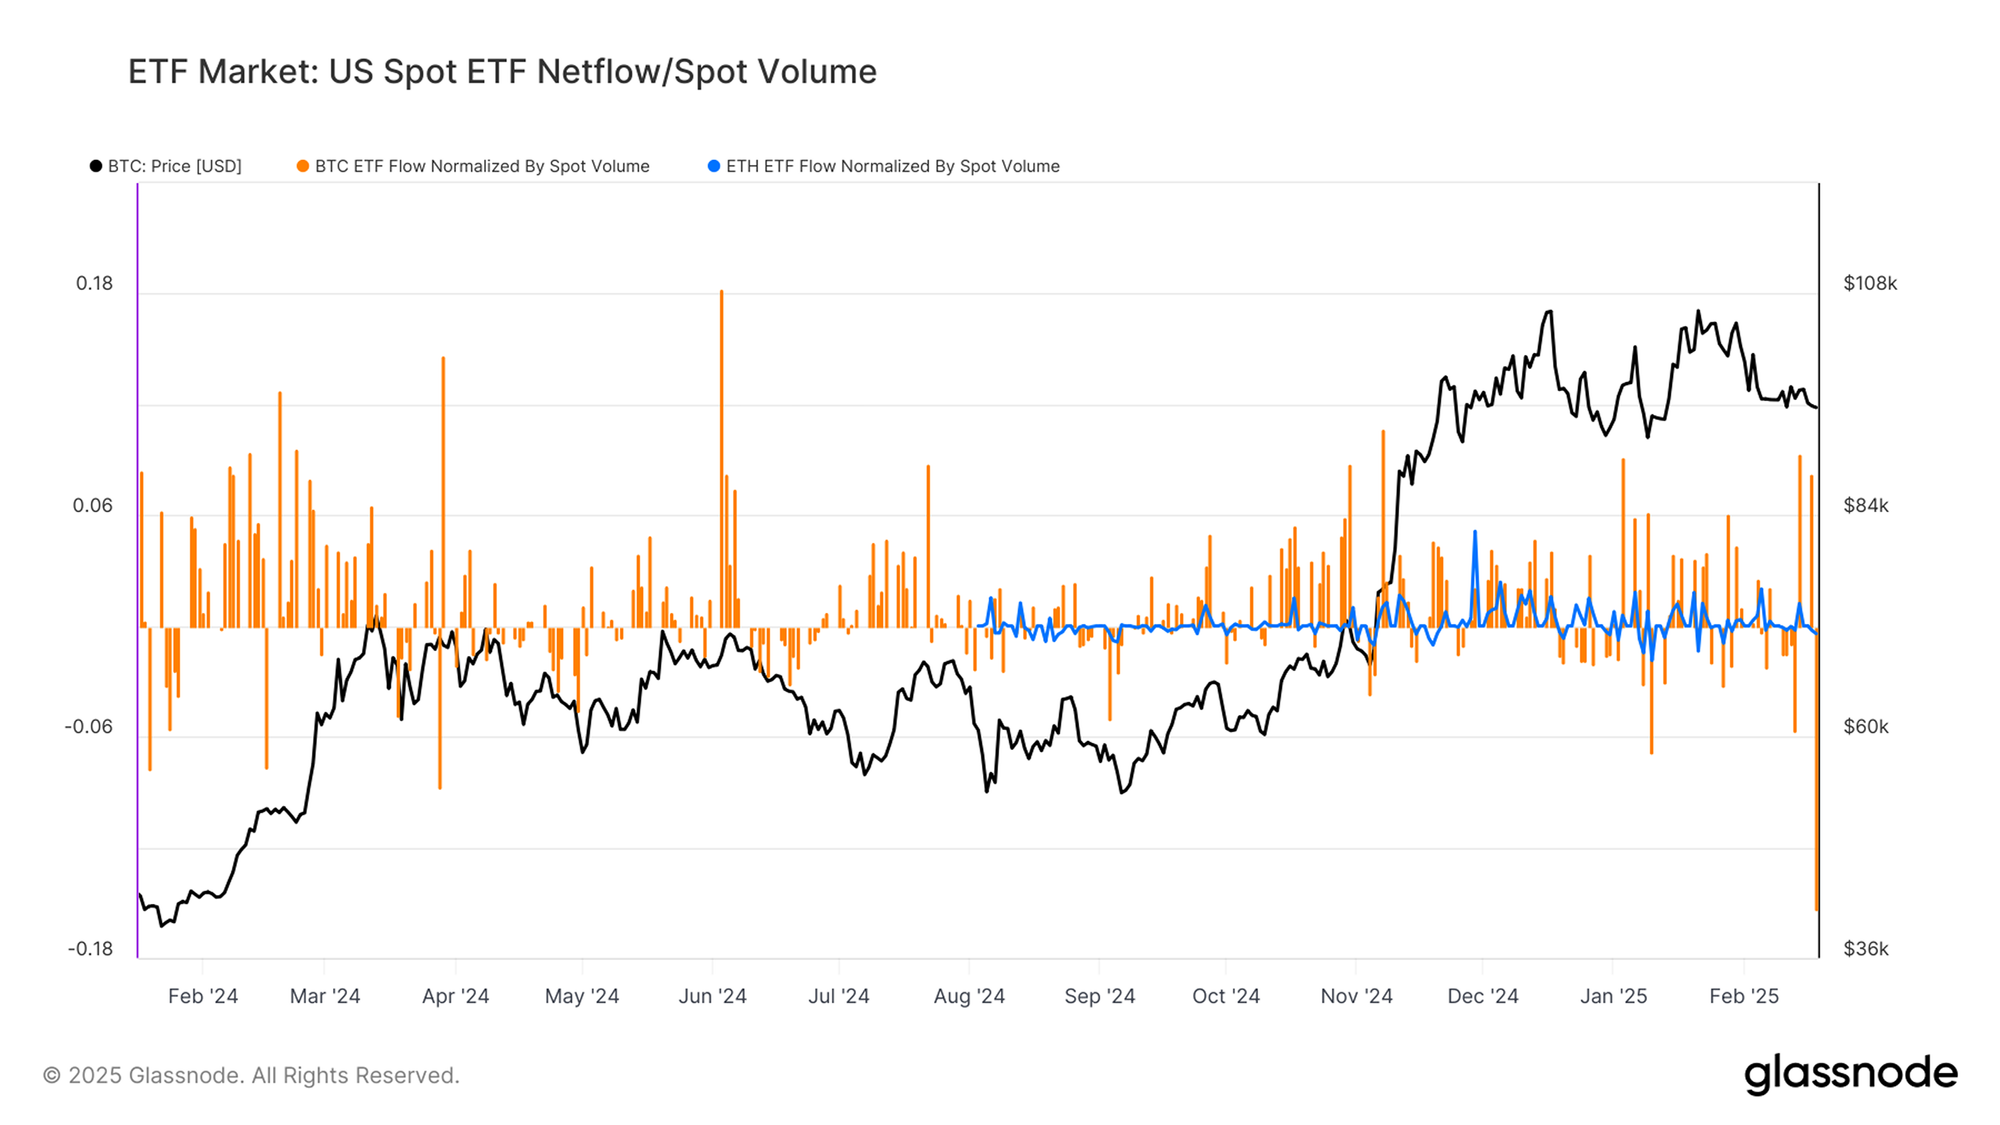
With the market in a contraction phase, institutional interest in Bitcoin and Ethereum has slowed based on spot ETF flows. By normalizing net inflows against each asset’s native spot volume, we can gauge the weight and influence of the ETFs on market dynamics.
- Bitcoin ETFs saw several outflows exceeding $200M/day last week, however this was followed by a strong rebound in buy-side activity, exceeding 8% of global spot volume, and highlighting institutional demand (akin to ‘buy the dip’ behavior).
- Ethereum ETF demand has cooled significantly and remains much smaller in scale compared to Bitcoin. ETF activity for ETH is hovering close to zero in terms of net flows in and out, suggesting a lack of strong traditional investor demand and participation.
This divergence has been a theme of this market cycle thus far and reinforces Bitcoin’s dominant role within the institutional asset mix. Ethereum continues to struggle to attract large, sustained inflows, which further explains its relative underperformance in recent years.
A Key Bull-Bear Threshold
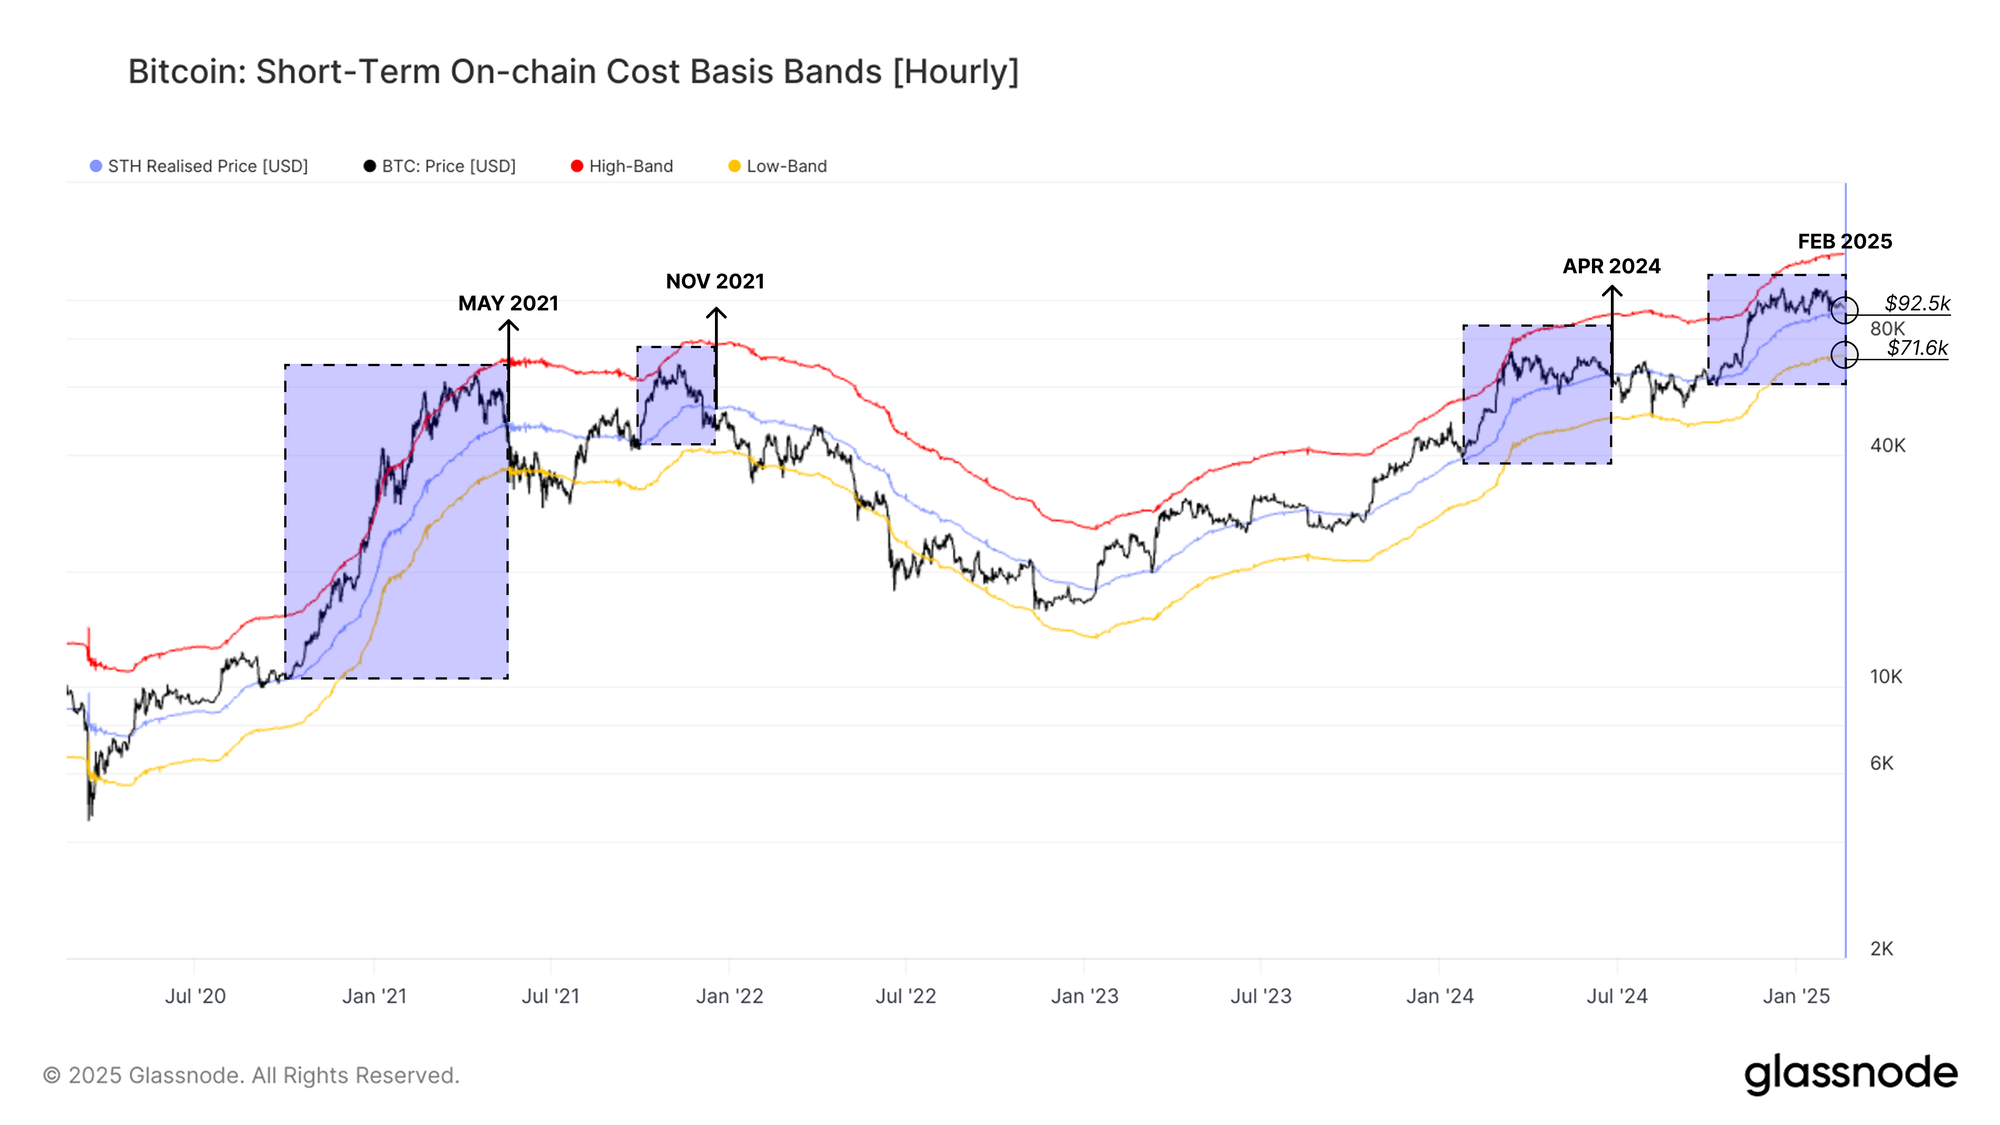
Bitcoin is currently trading $1k-$5k above the Short-Term Holder (STH) cost basis, located at $92.5k. Historically, this level has served as a key pivot point between local scale bull and bear phases, being the pivot point where the average recent buyer moves between a state of unrealized profit and loss.
Reviewing previous instances where Bitcoin reached a new ATH and then corrected lower, we can see a similar pattern in May 2021, Nov 2021, April 2024, and Feb 2024.
In each of these cases, the downtrend extended toward the lower band of the STH cost basis model, specifically -1 standard deviation (σ) below the cost basis. Currently, this lower band sits at $71.6K, helping frame up the potential downside risks should these historical patterns repeat.
Post ATH Consolidation
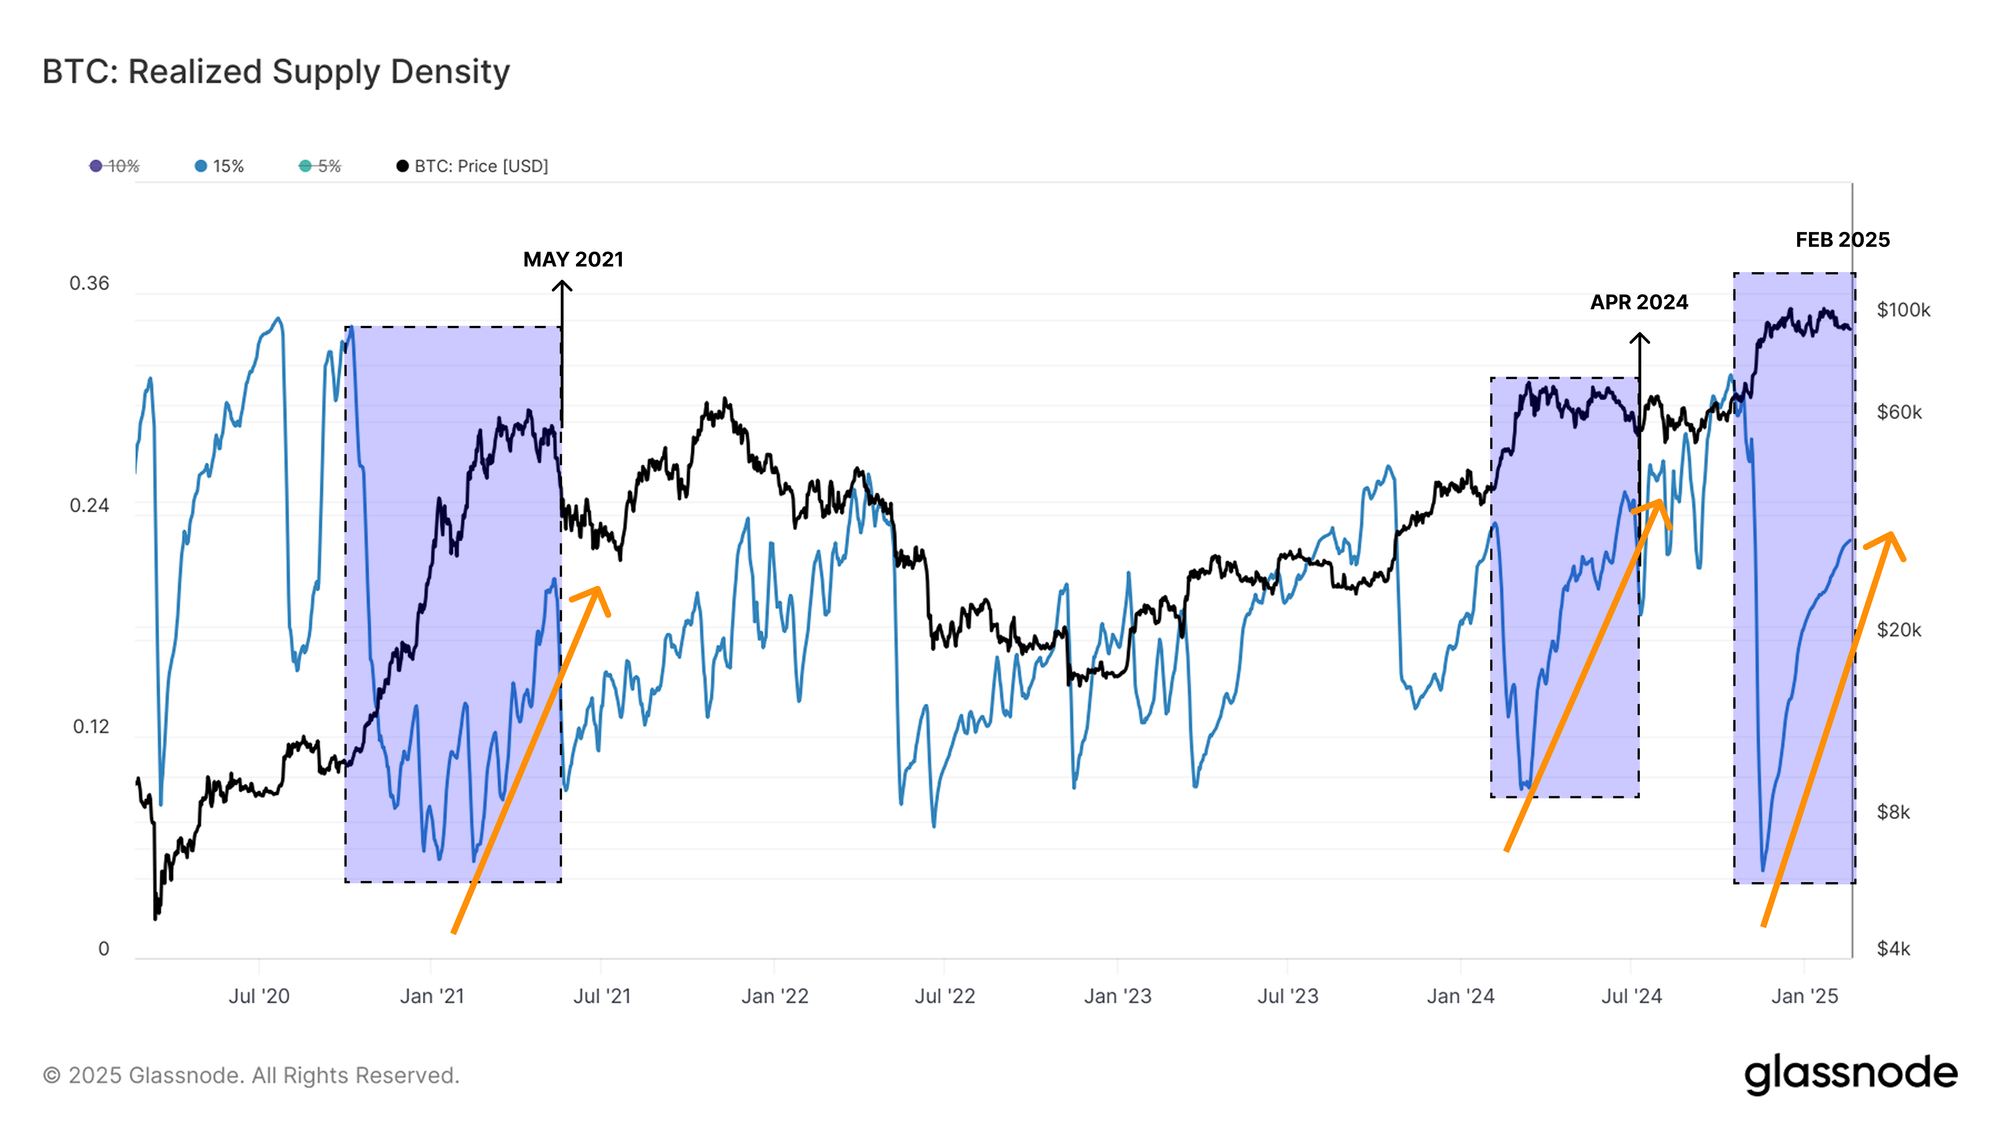
In prior instances where Bitcoin has reached a new ATH, we observe a consistent post-rally pattern, where a surge in realized supply density occurs within ±15% of the spot price. This results from the market transitioning from an aggressive uptrend into price consolidation, as the market trades within a relatively narrow range.
This behaviour is evident in previous cycle tops, where:
- As the market rallies within price discovery, the realized supply density crashes lower all the way up to the price peak.
- Market participants then begin redistributing coins as the market enters a correction or consolidation phase.
- This often occurs close to the STH cost basis, as the conviction and demand profile of new investors is tested.
The current realized supply density aligns with a typical post-ATH consolidation phase, where buyers and sellers try to establish a new equilibrium before the next major trend unfolds.
Approaching a Decisive Market Moment
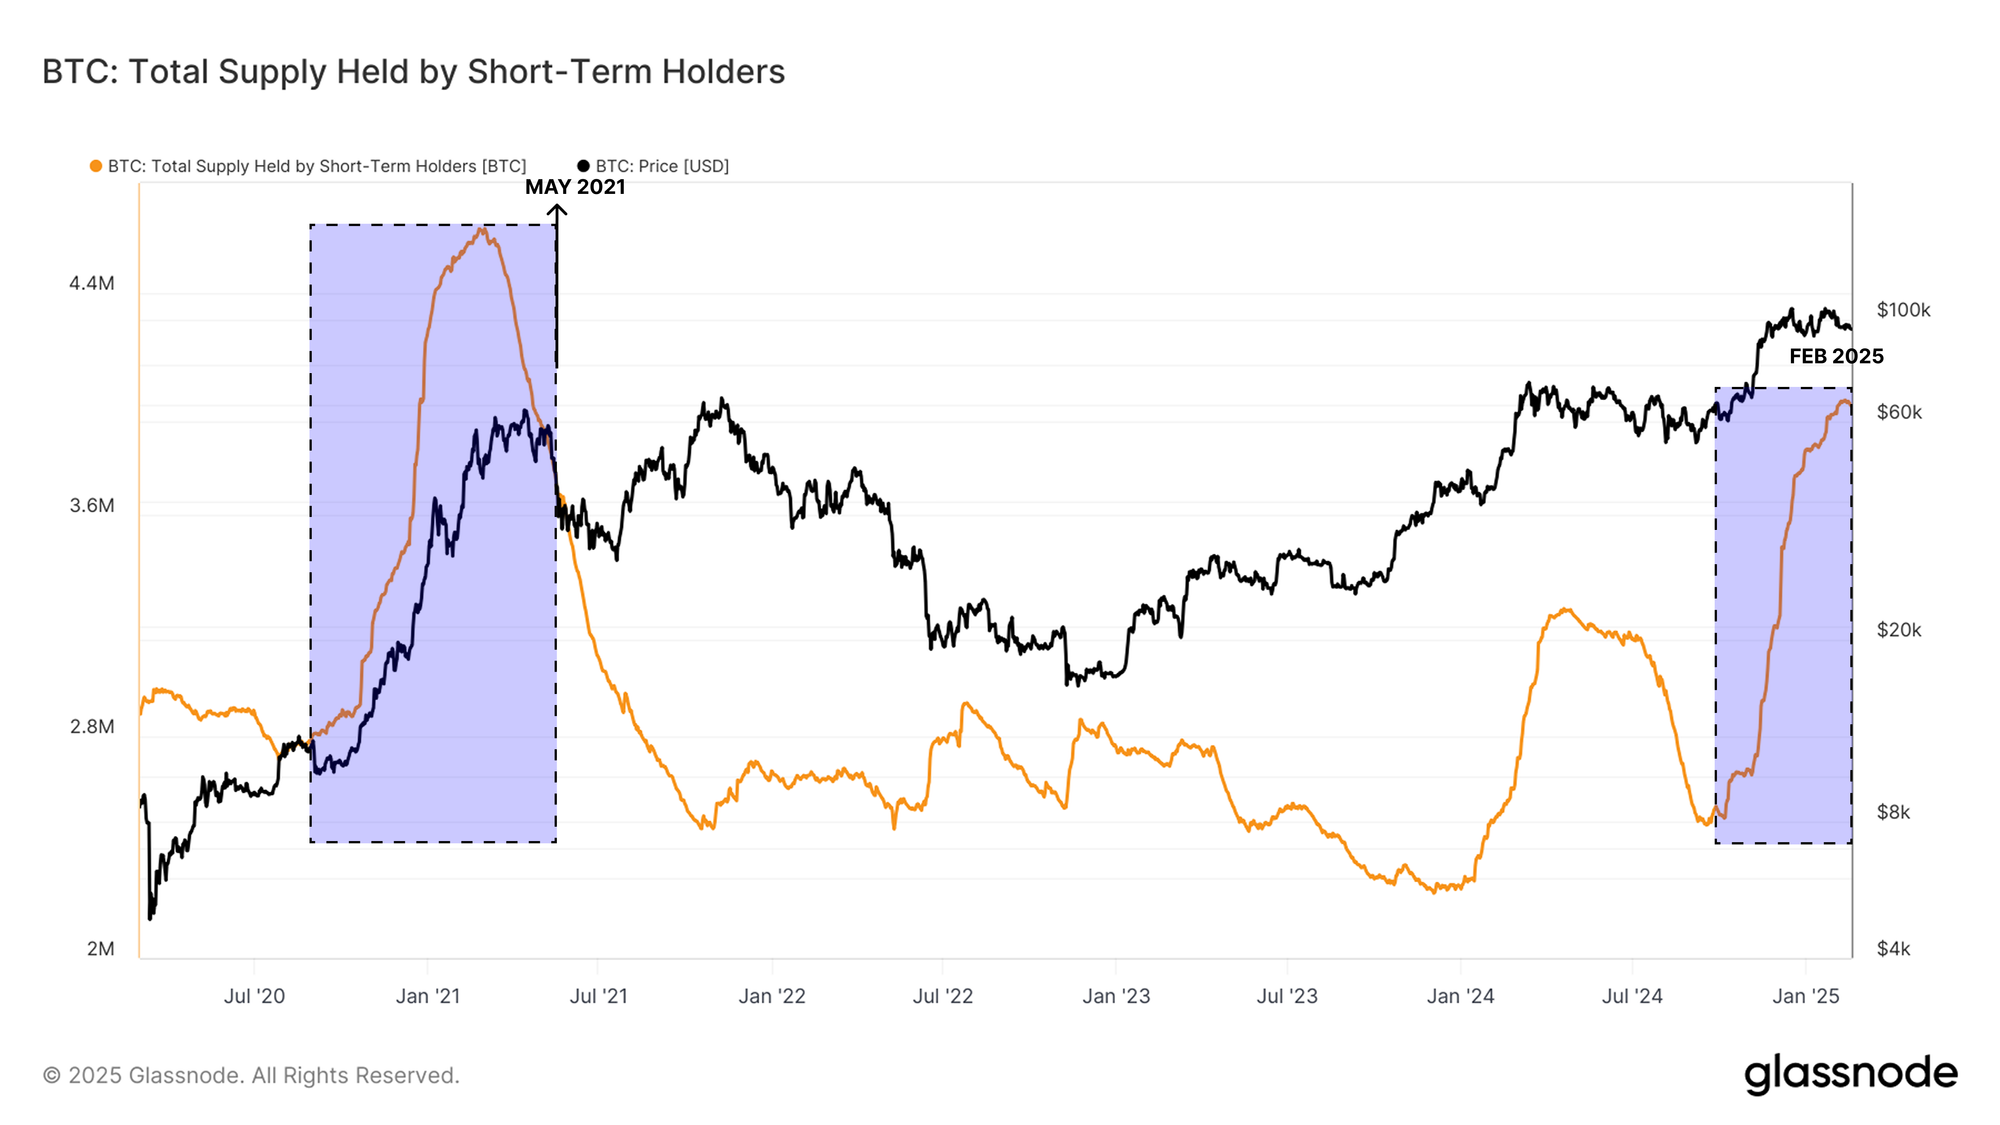
To better understand how sensitive the market is due to this supply density, we can analyze the supply held by short-term holders (STH) in recent post-ATH distribution phases. This helps gauge the patterns of new investor accumulation and whether current conditions resemble past cycle peaks.
When comparing STH supply changes, we observe:
- The recent accumulation phase closely mirrors May 2021, suggesting a similarly large amount of supply, and investors will be sensitive to a price decline below $92.5k.
- In April 2024, new investors also accumulated aggressively, but the magnitude of the STH supply uptrend in the current cycle structurally aligns more with May 2021 rather than 2024.
Given these similarities, we are now very close to a decisive moment in the market—a phase where price action is primed for uncoiling. If demand remains strong, Bitcoin could establish a new range above ATHs. However, a lack of sustained buy pressure could lead to a deeper distribution-driven correction, similar to prior post-ATH phases. This would likely be driven by panic amongst recent buyers who see their recently acquired coins move from being in profit to holding an unrealized loss.
Conclusion & Summary
Bitcoin has been consolidating around $95k for several weeks and is trading within a relatively stable range. The same cannot be said for the wider digital asset landscape, with Ethereum, Solana, and Memecoins all seeing significant drawdowns from their cyclical highs. In particular, Memecoins have seen a significant cool-off of demand, as evidenced by capital outflows, sharp price declines, and bearish sentiment in futures markets.
For Bitcoin, the key level to watch is the Short-Term Holder cost basis around $92.5k. This is a pivot point where a large proportion of recent buyers will see their holdings move into an unrealized loss. This could precipitate more downside as panic sets in. In either case, the current consolidation phase appears to be nearing its later stages, and the market looks ready to trend in one direction once again.
Disclaimer: This report does not provide any investment advice. All data is provided for information and educational purposes only. No investment decision shall be based on the information provided here and you are solely responsible for your own investment decisions.
Exchange balances presented are derived from Glassnode’s comprehensive database of address labels, which are amassed through both officially published exchange information and proprietary clustering algorithms. While we strive to ensure the utmost accuracy in representing exchange balances, it is important to note that these figures might not always encapsulate the entirety of an exchange’s reserves, particularly when exchanges refrain from disclosing their official addresses. We urge users to exercise caution and discretion when utilizing these metrics. Glassnode shall not be held responsible for any discrepancies or potential inaccuracies. Please read our Transparency Notice when using exchange data.


All Comments