


From cointelegraph by Rakesh Upadhyay
Bitcoin BTC$105,124 recovered sharply from the weekly lows and is charging toward the all-time high of $104,088. VanEck expects the cryptocurrency bull market to hit its first peak in the first quarter of 2025. After that, the asset manager anticipates a 30% pullback in Bitcoin and a sharper retracement of up to 60% in altcoins. The recovery is expected to begin in fall, with “major tokens regaining momentum and reclaiming previous all-time highs by the end of the year.”
Another bullish voice was that of Bitcoin mining industry researcher Danny Marques, who studied Bitcoin’s three previous bull cycles. Marques believes that Bitcoin could reach between $173,646 and $461,135 in 2025, barring any macro deterioration like 2020.
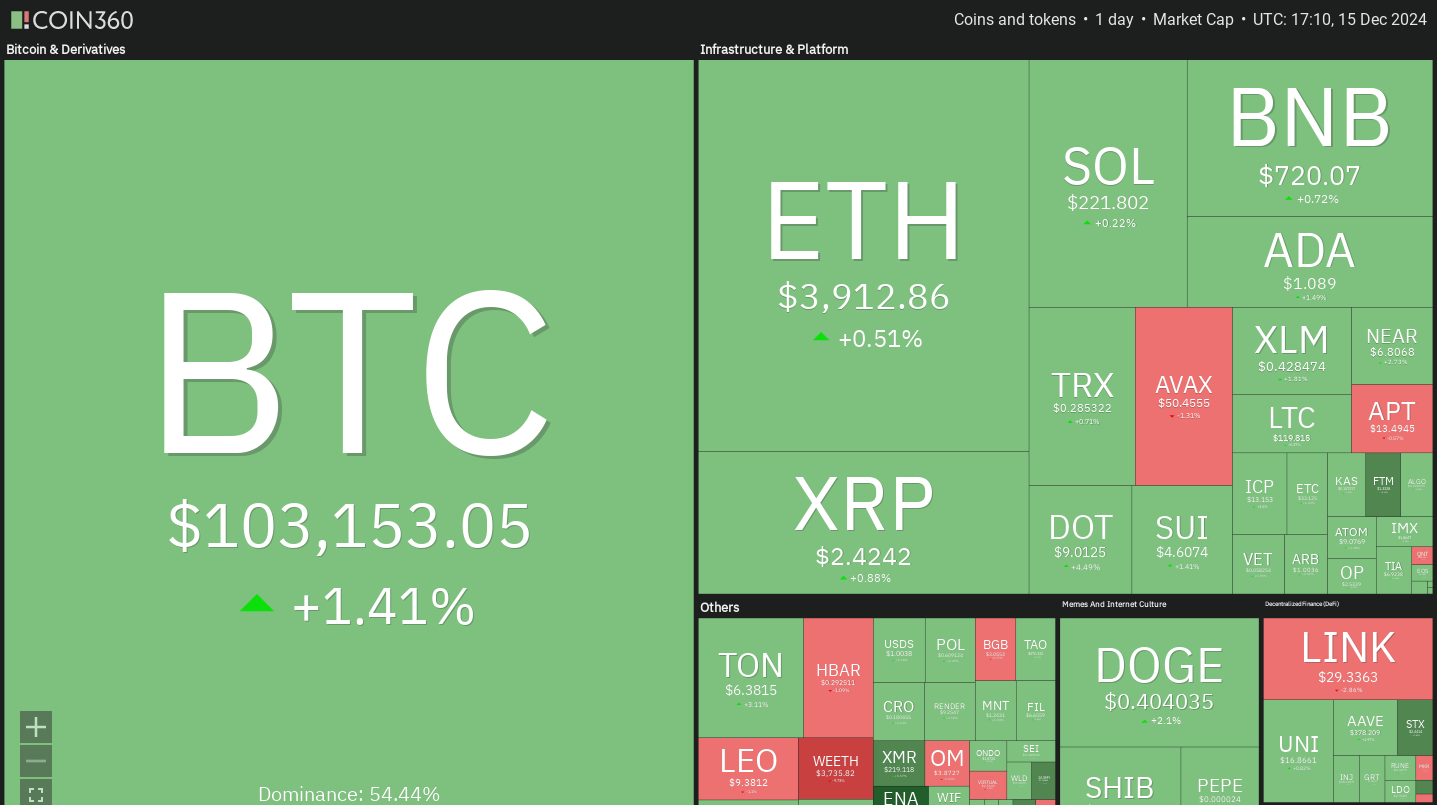
Bitcoin is not alone; analysts expect Ether ETH$3,977.60 to play catch up in 2025. Bybit analysts told Cointelegraph that Ether is showing strength in the derivatives market and could hit “a new all-time high in Q1 2025.”
In the short term, if Bitcoin breaks and maintains above $104,088, select altcoins could charge higher. Let’s look at the top 5 cryptocurrencies with a strong chart structure.
Bitcoin price analysis
Bitcoin has been gradually moving toward the $104,088 overhead resistance, indicating a lack of aggressive selling by the bears.
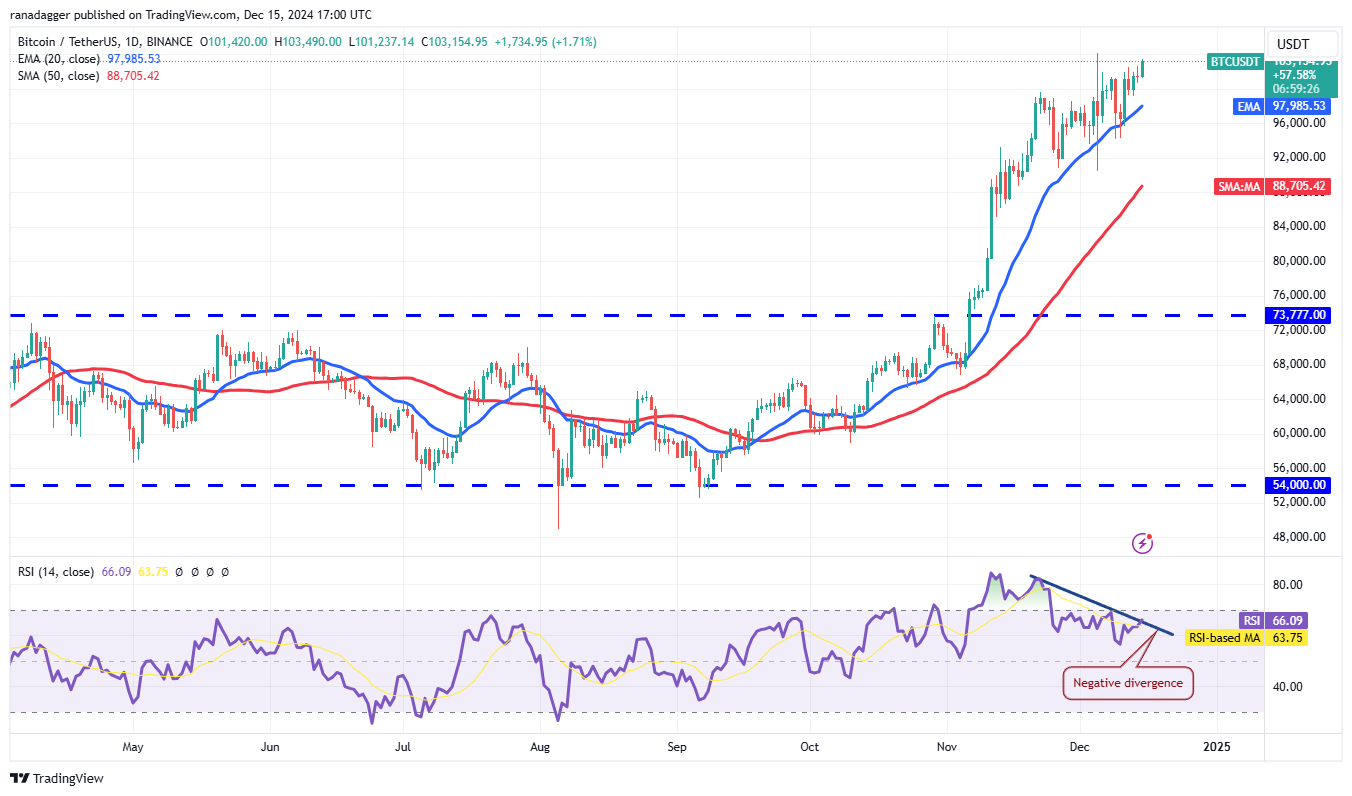
A minor negative is that the relative strength index (RSI) is forming a negative divergence, indicating a weakening bullish momentum. Sellers will have to yank the price below the 20-day exponential moving average ($97,985) to open the doors for a fall to the 50-day simple moving average ($88,705).
On the upside, a break and close above $104,088 will signal the resumption of the uptrend. The BTC/USDT pair could rally to $113,331 and, after that, to $125,000.
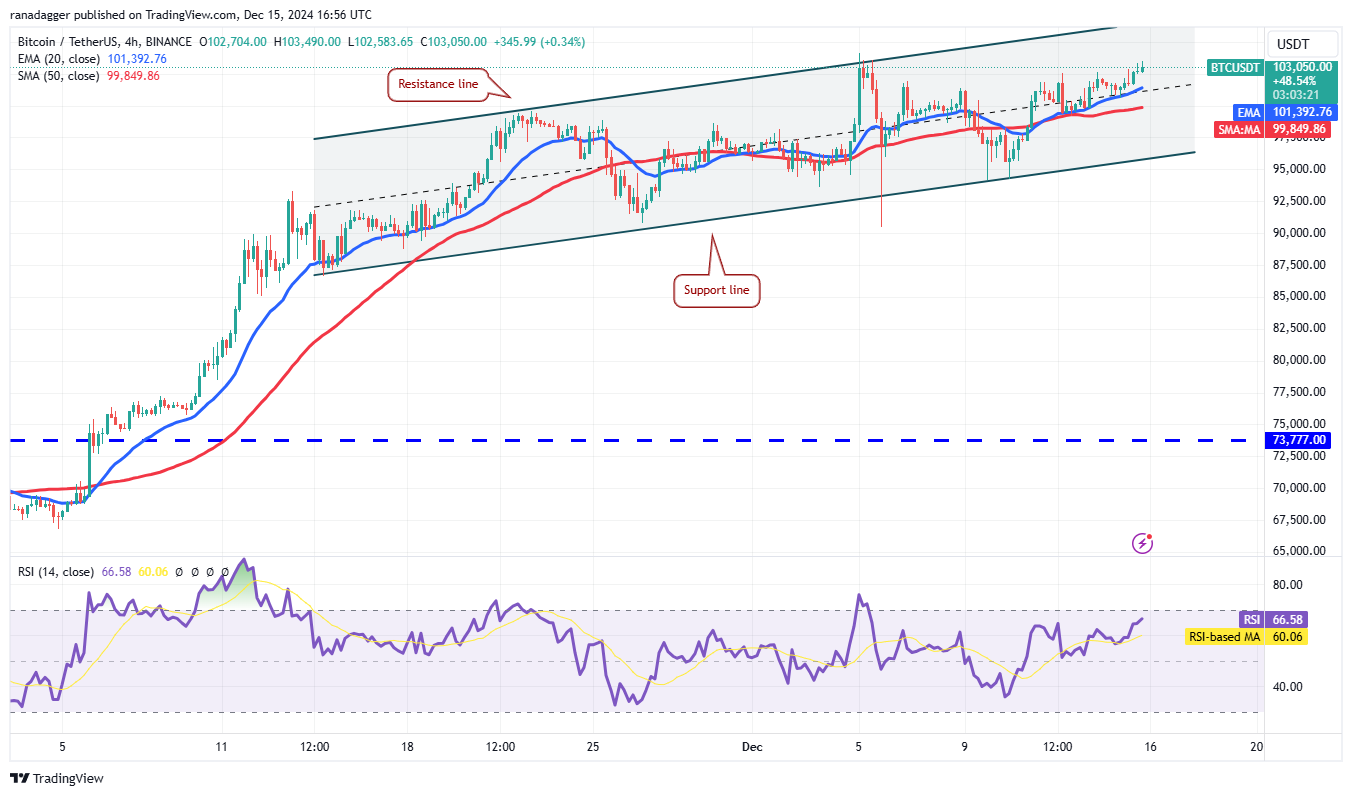
The pair could reach the resistance line near $107,000, which is expected to act as a solid resistance. If buyers overcome the resistance, the pair is likely to pick up momentum and surge to $113,331.
If the price turns down from the current level or the resistance line and breaks below the moving averages, it will suggest that bears are selling on rallies. The pair may slump to the support line, which is an important level to watch out for. If the bears sink the price below the support line, the pair may drop to $86,700.
Ether price analysis
Ether is facing significant resistance in the $4,000 to $4,094 zone, but a positive sign is that the bulls have not given up much ground to the bears.
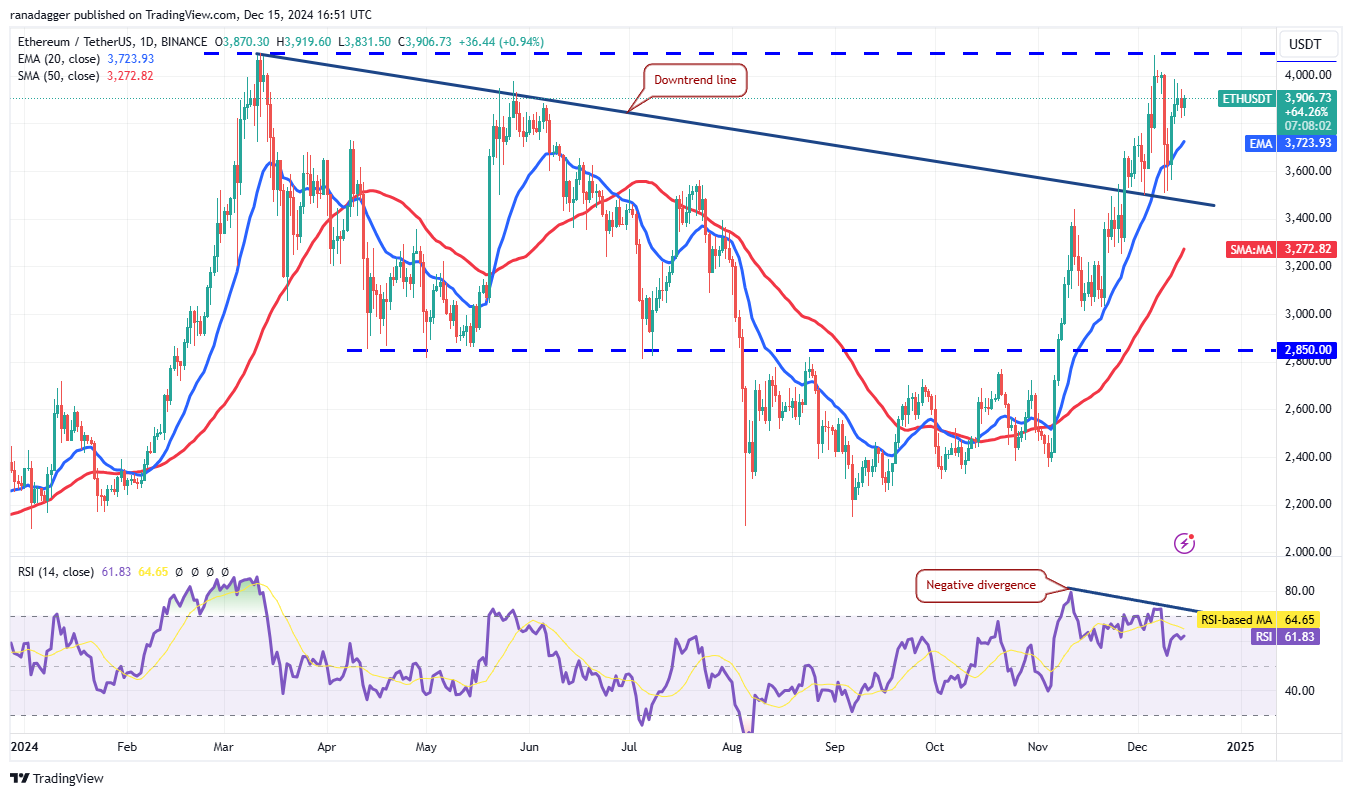
The upsloping moving averages indicate advantage to buyers, but the negative divergence on the RSI suggests that the uptrend is slowing down. If the 20-day EMA ($3,723) cracks, the ETH/USDT pair could drop to the downtrend line. Such a move is likely to delay the start of the next leg of the uptrend.
Contrarily, if the price turns up from the current level or the 20-day EMA, it will signal a positive sentiment. That improves the prospects of a break above $4,094. If that happens, the pair could surge to $4,500.
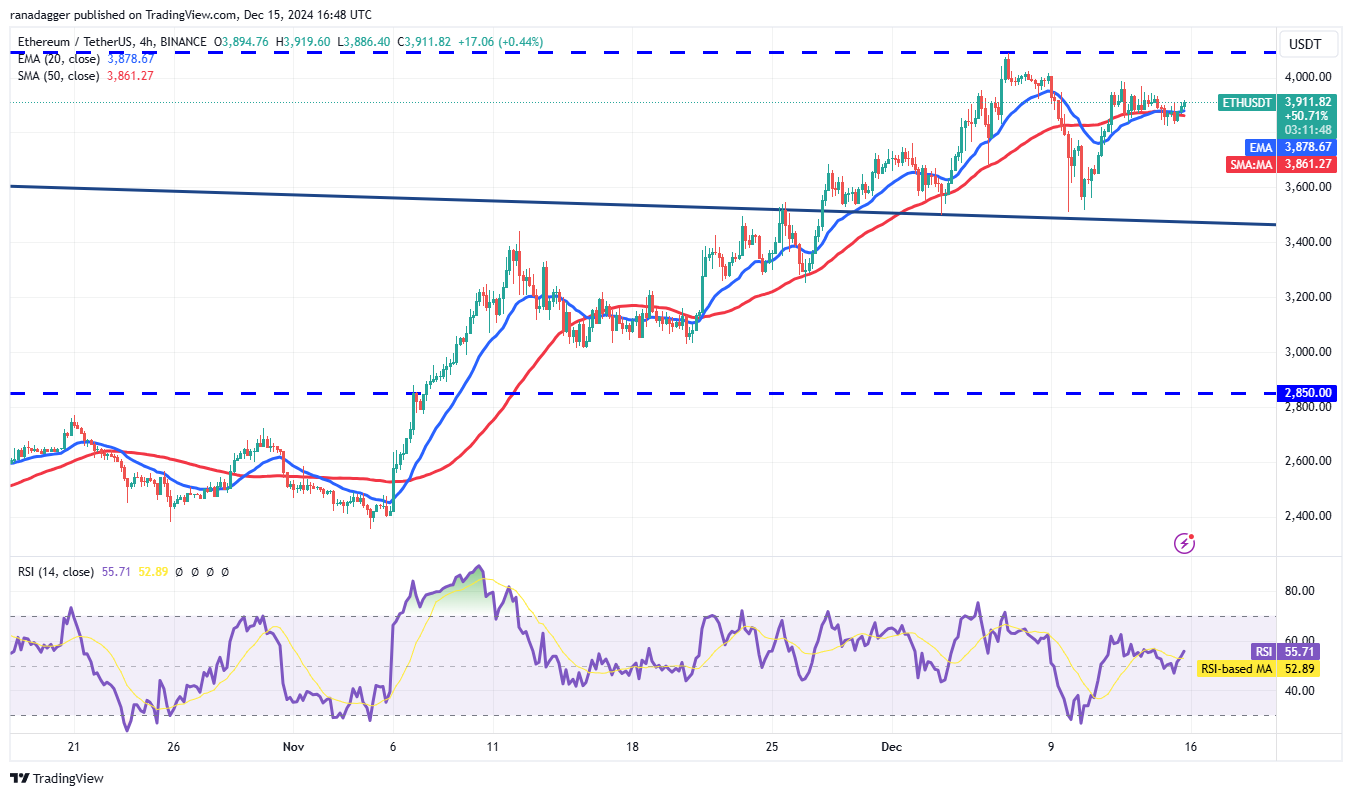
The moving averages on the 4-hour chart have flattened out, and the RSI is just above the midpoint, suggesting a possible range-bound action in the near term. The pair may consolidate between $4,094 and $3,500 for some time.
Buyers will have to drive the price above $4,000 to increase the likelihood of a break above $4,094. The pair could then rally to $4,500. Alternatively, a drop below $3,500 will tilt the advantage in favor of the bears.
Chainlink price analysis
Chainlink LINK$29.41 is in an uptrend, but the long wick on the Dec. 13 and Dec. 14 candlestick shows that the bears are selling above $30.
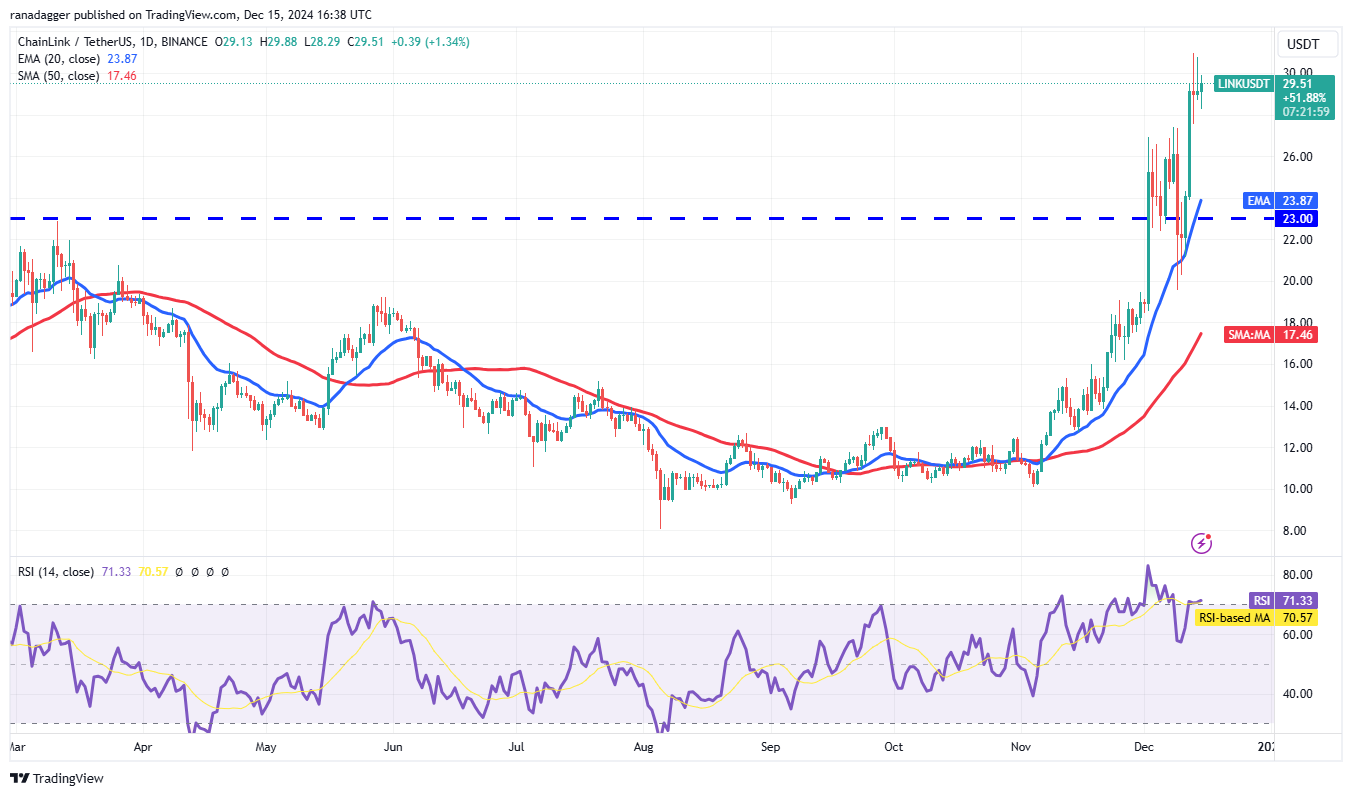
The $27.41 level is the crucial support to watch out for on the downside. If the price turns up from the current level or bounces off $27.41 with strength, it will increase the possibility of a break above $31. The LINK/USDT pair could then start the next leg of the uptrend to $34.50 and later to $38.30.
This positive view will be invalidated in the near term if the price breaks below $27.41. That could sink the pair to the 20-day EMA ($23.87), which is an essential support for the bulls to defend.
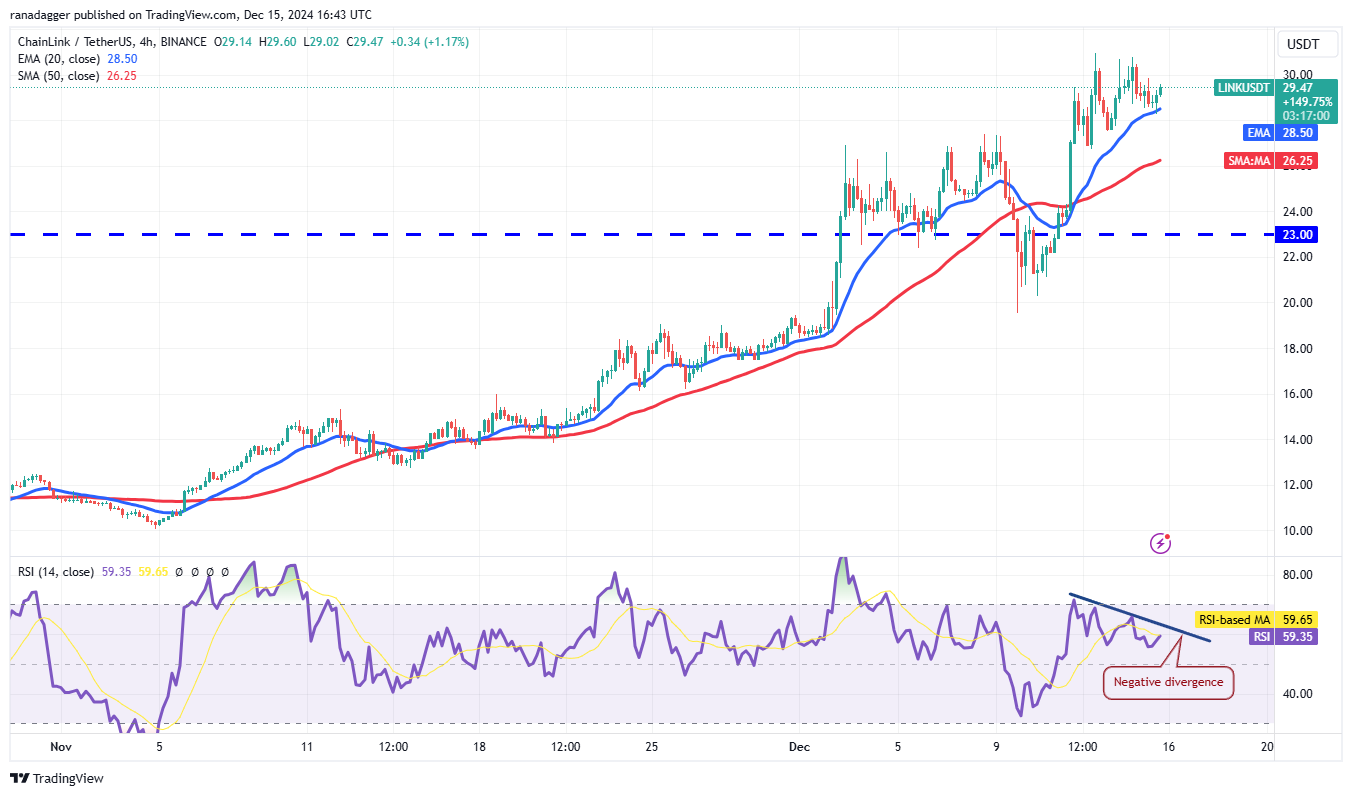
The RSI is showing a negative divergence on the 4-hour chart, indicating that the up move is losing steam. A break and close below the 20-EMA will suggest that the bears are trying to make a comeback. The 50-SMA is an important support for the bulls to defend because if they fail in their endeavor, the pair may plummet to $23.
If buyers want to prevent the deep correction, they will have to quickly push and maintain the price above $31. If they do that, the pair is likely to accelerate toward $34.50.
Related: Trump may use Bitcoin as US reserve asset on 'day one' — How high will BTC price go?
Aave price analysis
Aave AAVE$381.90 turned up from the 20-day EMA ($283) on Dec. 10 and broke above the near-term resistance of $300 on Dec. 11.
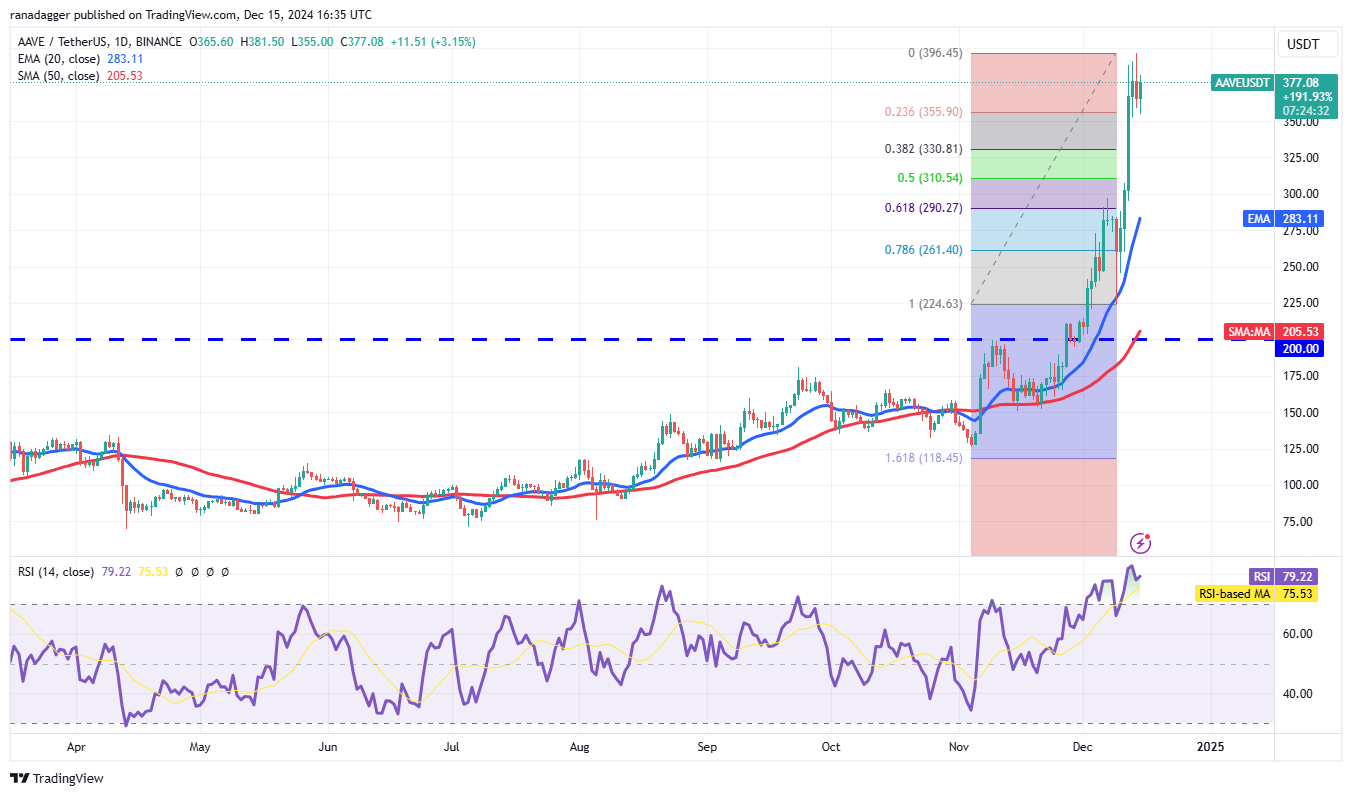
The AAVE/USDT pair is facing selling near $400, but the bulls have not ceded much ground to the bears. This suggests that the bulls are holding on to their positions as they anticipate the up move to continue. If buyers thrust the price above $400, the pair could skyrocket to $450.
The first support on the downside is the 38.2% Fibonacci retracement level of $330. If the price rebounds off this support, the likelihood of an upside breakout remains. On the other hand, a break below $330 could sink the pair to the 20-day EMA ($283).
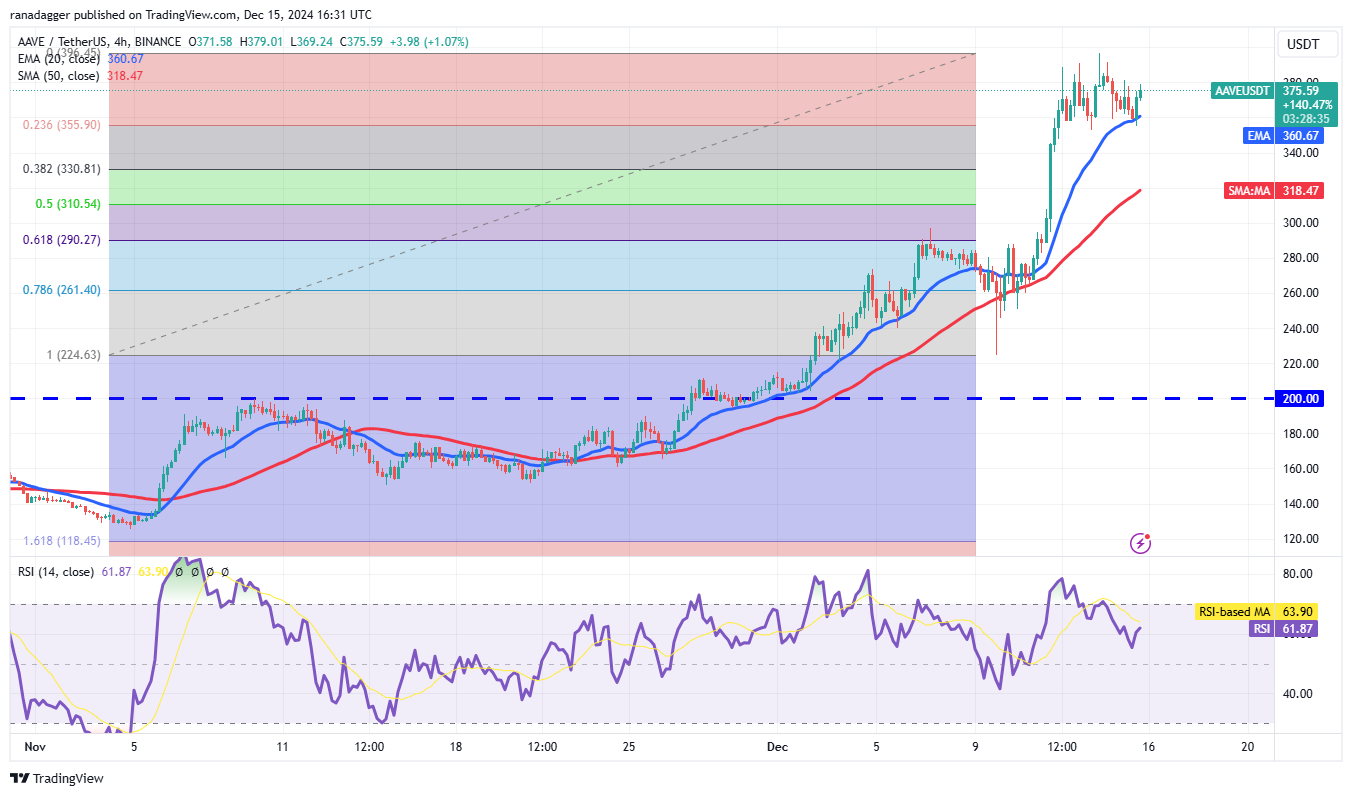
The pair has rebounded off the 20-EMA, which is a critical near-term support for the bulls to defend. If the price maintains above the 20-EMA, the bulls will try to propel the pair above the $400 resistance.
Instead, if the price turns down and breaks below the 20-EMA, it will suggest that the buyers are booking profits. The pair may drop to the 50-SMA, which is likely to attract strong buying by the bulls.
Bitget Token price analysis
Bitget Token (BGB) has been in a strong uptrend, but the rally turned down from $3.50 on Dec. 12, signaling profit booking by traders.
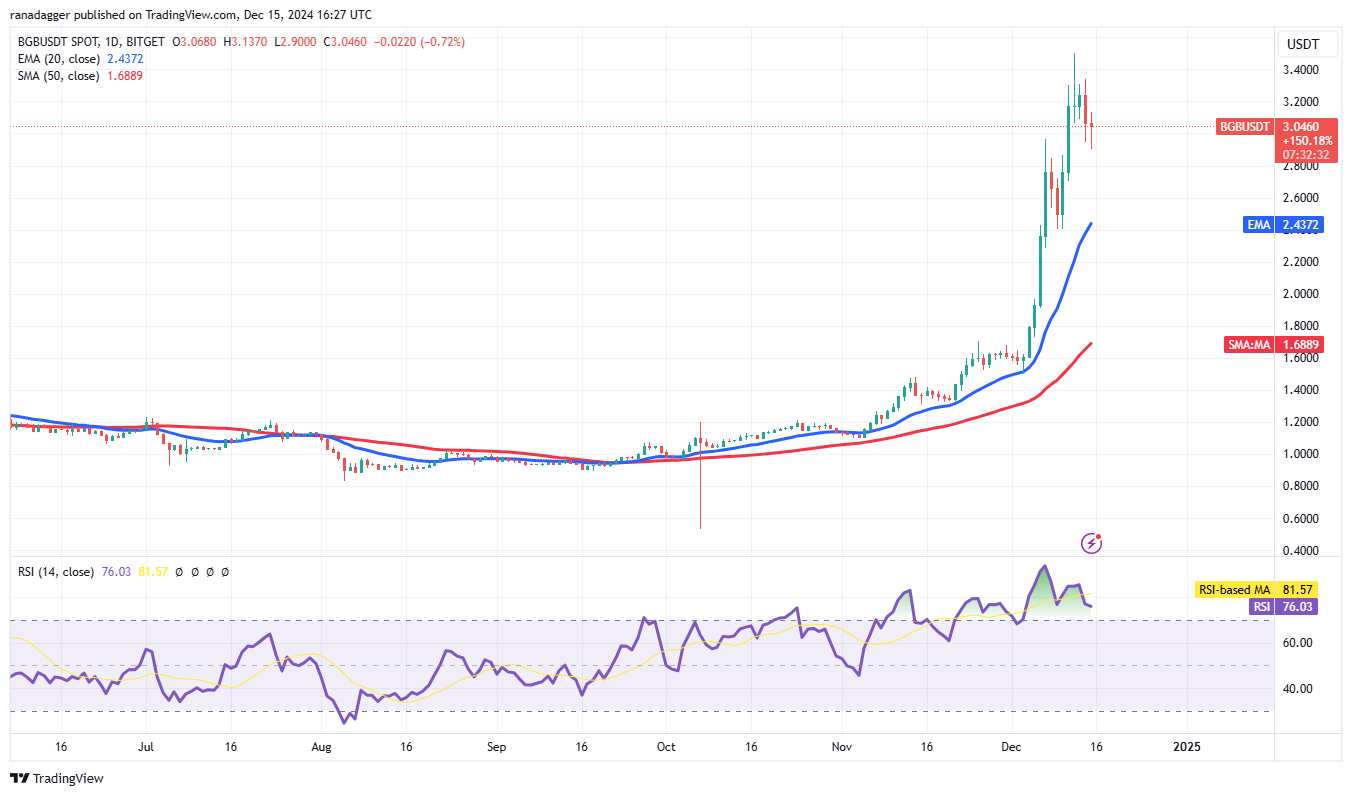
The bulls are trying to arrest the decline at $3. If the price turns up from the current level, the BGB/USDT pair will again attempt to rise above the overhead resistance of $3.50. If that happens, the rally could extend to $4.
Contrary to this assumption, if the price maintains below $3, the bears will try to pull the pair to the 20-day EMA ($2.43). Such a deep pullback increases the possibility of a range formation in the near term.
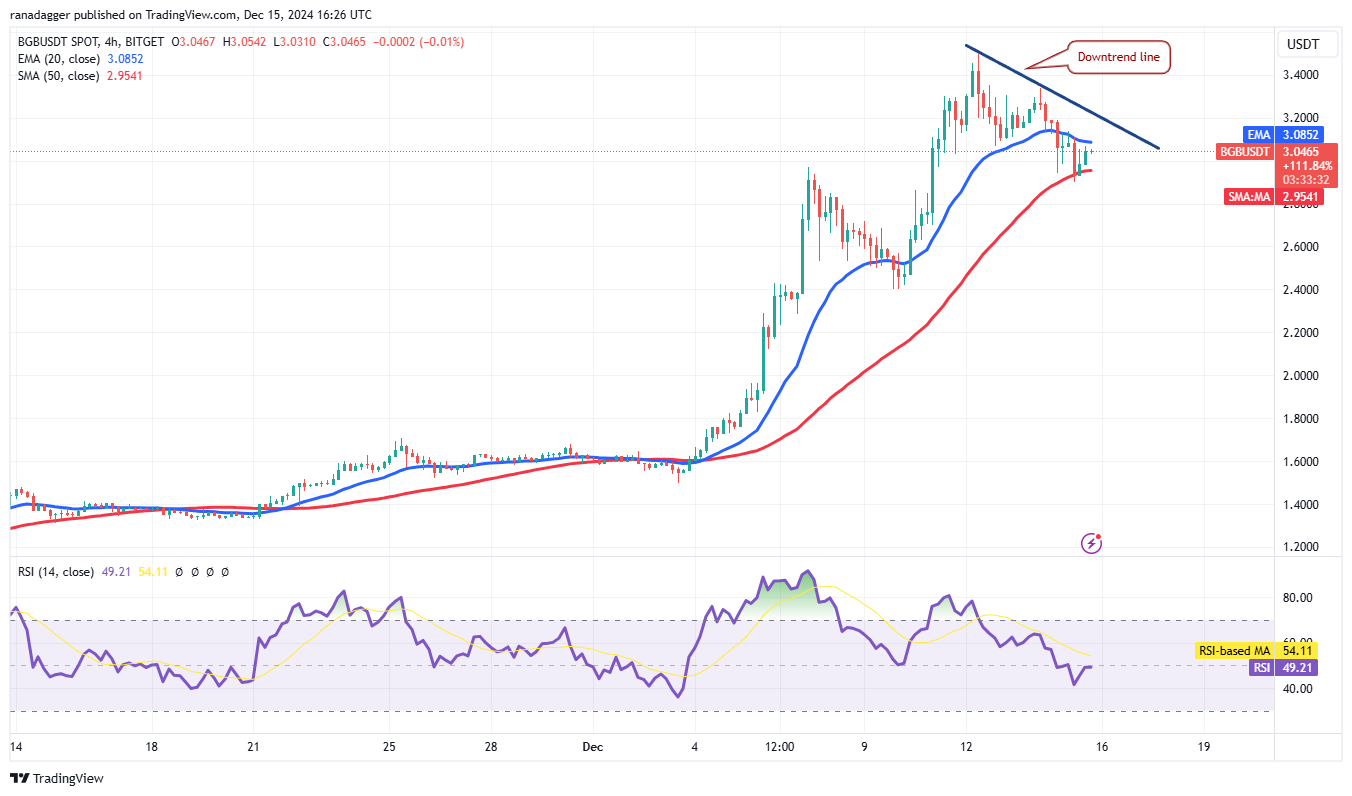
The bulls are trying to start a rebound off the 50-SMA, but the recovery is expected to face selling at the downtrend line. If the price turns down sharply from the downtrend line, the possibility of a break below the 50-SMA increases. That could start a decline to $2.40.
On the contrary, if the price rises above the downtrend line, it will suggest that the pullback may be over. The pair could rise to $3.34 and subsequently to the overhead resistance of $3.50. If this level is cleared, the pair may start the next leg of the uptrend.


All Comments