


Market capitalization and FDMC allow $APT to grow 5–10 times more and enter the top 10 tokens in terms of capitalization, but that growth must be healthy and smooth.
Turning the concept of healthy growth around, we can define it as growth based on ecosystem development, protocol development within the network, and increasing token price by accumulating inside value.
Aptos is a muddy river
The current rate of growth in $APT is unsustainable, as we have seen in $SOL, $AVAX, and $NEAR. Given that these examples already had their own narratives at the time of growth, $SOL had DeFi and NFT as well as an EVM-like network for capital and liquidity migration, $AVAX had DeFi, and $NEAR had DeFi, NFT, and Aurora, a protocol compatible with EVM networks. Aptos currently lacks all of these features, including advanced protocols of its own, formed narratives within the ecosystem, and full EVM support. Aptos as a market has become a very muddy river for us, with no idea what is going on on the other side of the water surface.
The data proofs
Let’s start with the basics of any crypto protocol research — TVL. We will move in chronological order.
08.12–28.12
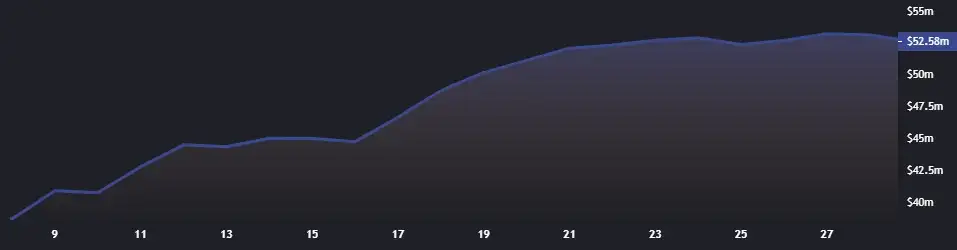
TVL: up from 38 to 52 million USD.
Total and local value of TVL: up 14 million USD
The $APT token price:
- 08.12–4.9$
- 28.12–3.2$
This period is characterized by minimal trading volumes, low volatility and consistent and smooth growth of TVL, as well as consistent and smooth fall of $APT. Most likely, it was at this point that the most astute users began to enter the market and invest their funds in APT protocols, while traders gradually sold their $APT tokens.
28.12–08.01
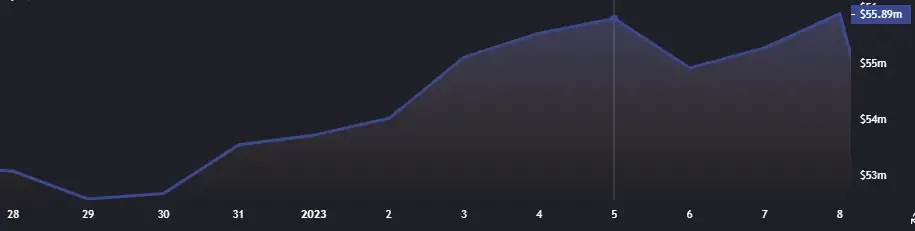
TVL: up from 53 to 56 million USD.
Local value of TVL: increased by 3 mln USD
Total TVL value: up 17 million USD
APT$ token price:
28.12–3.1$
08.01–3.9$
This period is characterized by a sluggish market, weak volumes and little growth in TVL
08.01–10.01

This is when the most interesting things start to happen, watch closely.
TVL: fall from 56 to 49 million USD/.
Local value: down 7 million USD
Total value: up 10 million USD
Token price $APT:
08.01–3.9$
10.01–5.8$
The peculiarity of this period consists in the following things:
- There were no more $APT sellers, only those who wanted to sell between 08.12 and 28.12 and before that.
- The fall of TVL began, and some users who came between 08.12 and 08.01 began to fix profit, confirming the fall of TVL and the rise of token.
- The most significant change is that on January 9, a user or group of users purchased $APT, which increased from $4.1 to $5.3. These were clearly not retail purchases, as the entire retailer was either in the red or had already sold their tokens. They were also not purchases by users who contributed to TVL because there was no TVL growth, users were already in position, and users were withdrawing $APT from protocols. To comply with risk management, 7 million of the 17 USD invested between 08.12 and 08.01 were withdrawn and most likely fixed.
After one month of market activity, the question remains: where did the buyers come from on January 9th, and who were those buyers? Answering this question will lead to the answer to another. At that point, who could have been the sellers?
There is no doubt about the sellers; all of the retailers dumped $APT, on-chain pharmacists were holding $APT in protocols and their price was about at breakeven, and only early investors, who were most likely already profiting from $APT bags, could afford to hold and buy in large volumes.
Whatever happened next with the $APT price is irrelevant to us.
- Retailers continued to buy tokens as they anticipated FOMO and reversal.
- Onchain farmers and TVL providers received additional protocol rewards, existing farmers were most likely joined by new users, and TVL increased from 49 million to 59 million.
- The big players continued to drive $APT growth, most likely because they were capturing their super profits in installments. These are the times when we see pullbacks and price corrections on the charts.
You’ll agree that it’s difficult to call an asset pure if its growth was fueled by a small group of big players who profited handsomely. Congratulations to those who were able to profit from their bullishness and long-term analysis; good job!
What do we think about $APT?
- If you are not yet in a position, do not enter because you do not know the situation in this asset. If the whales need to fix their profits tomorrow, believe me, they will, and you will fall along with the price.
- If you are already in position, then calculate all of the possible outcomes when the whales must lock in their profits. It will not make sense to pump $APT because it will be too expensive. Follow your vision.
- Take this case apart, reread this article again, follow the basic patterns, and keep this strategy in mind.



All Comments