

Author: [email protected]
In the crypto world, understanding the movement of funds, or “money flow,” is crucial for investors, traders, and anyone interested in the crypto market.
Money flow represents the dynamic transfer of capital within the cryptocurrency ecosystem, shaping market sentiment and influencing trading activities. In this article, we will delve into the concept of money flow, why it matters, and how tracking it can provide valuable insights into this ever-evolving financial landscape.
Money flow in the cryptocurrency space refers to the fluid movement of funds among various entities, including exchanges, wallets, blockchain protocols, and platforms. It encompasses the entire financial circulation within the digital asset world, and it’s not limited to any one participant. Rather, it represents a comprehensive view of capital movement, reflecting how cryptocurrencies change hands and traverse the digital landscape.
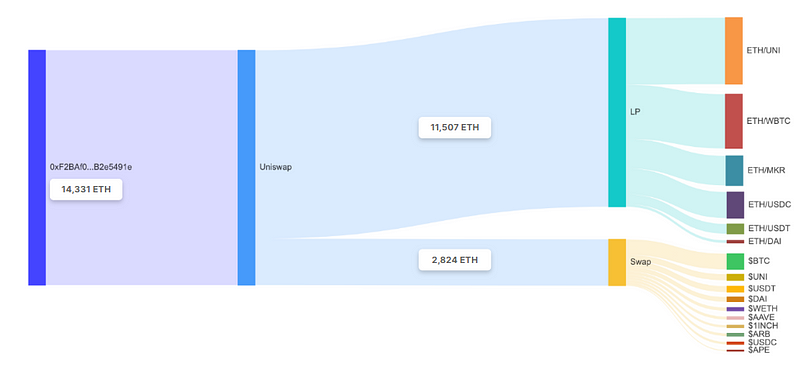
Indeed, blockchain technology has provided the transparency and immutability needed to track the flow of funds within the cryptocurrency ecosystem. However, it’s essential to acknowledge that blockchain’s inherent features, such as anonymity and the often unstructured nature of data, can make it challenging for individuals to independently trace these fund flows. Achieving a clear and comprehensive money flow monitoring system often requires the expertise of professional teams dedicated to tagging addresses and contracts and conducting extensive data analysis, which need bunch of crypto reference data as its basis.
Gauge market sentiment and confidence in certain assets: Monitoring money flow is crucial for investors seeking to understand the prevailing sentiment and confidence surrounding specific cryptocurrencies or projects. Significant inflows can signal positive investor sentiment and the potential for price appreciation.
Identify potential support and resistance levels: Money flow data can help investors identify potential support and resistance levels. Large inflows to cryptocurrency exchanges, for example, may act as price barriers and support levels, indicating where the market may find buying or selling pressure.
Inform trading decisions: Investors can use money flow data to make more informed trading decisions. By timing entries and exits based on periods of heavy inflows or outflows, investors can maximize the potential for profit and minimize losses.
Assess liquidity conditions across exchanges and DeFi platforms: Analysts can use money flow data to assess liquidity conditions within the cryptocurrency market. Understanding the flow of capital helps in evaluating how easily assets can be bought or sold without causing significant price fluctuations.
Analyze market cycles and stages: Money flow analysis allows analysts to follow capital rotations between different crypto sub-sectors. This can provide insights into market cycles and stages, helping them anticipate shifts in investor focus.
Estimate trading volumes and activity: Money flow data is closely tied to trading volumes. Analysts can estimate trading activity by examining the movement of funds and understanding how it correlates with trading volumes on exchanges.
Understand investor and trader behavior: Money flows reveal investor and trader intentions and strategies. Researchers can gain valuable insights into how market participants are positioning themselves by studying money flow patterns.
Track adoption rates of new protocols: Monitoring money inflows can help researchers track the adoption rates of new blockchain protocols and projects. Rising protocol usage and increasing popularity are often reflected in growing money inflows.
Identify macro market trends: Money flow data can be used to analyze cyclical shifts between the crypto market and traditional financial markets. This helps researchers identify macro market trends and correlations that impact the cryptocurrency ecosystem.
Indeed, while blockchain data is transparent and accessible, it’s not always easy to interpret, and numerous platforms have emerged to bridge the gap between raw on-chain data and meaningful insights. Data platforms like MetaMosaic play a crucial role in making the blockchain more user-friendly and informative. Here’s a breakdown of how these platforms source their data:
In this method, artificial intelligence (AI) tools are utilized to automatically tag wallet addresses and smart contracts associated with specific entities or projects. These AI algorithms analyze patterns, behaviors, and historical data to categorize addresses. This approach is efficient and scalable, enabling real-time monitoring of money flow.
Manual address tagging involves human intervention to label wallet addresses and contracts. This method is particularly useful when dealing with new or unique entities that may not be recognized by AI systems. While it can be more time-consuming, it offers a higher level of accuracy and customization.
On-chain transaction tracking involves analyzing the blockchain’s transaction history. This method provides a transparent and decentralized approach to understanding the flow of funds. By examining transaction records and blockchain explorers, you can gain insights into the movement of cryptocurrencies between addresses, providing a comprehensive view of money flow.
Each of these methods has its strengths and can be used individually or in combination to track money flow effectively, depending on the specific needs and goals of investors, analysts, and researchers in the cryptocurrency space. These platforms provide a vital Single Source of Truth (SSoT) for those seeking to make sense of the complex web of on-chain and off-chain data in the world of Web3 and cryptocurrencies.
In the fast-evolving realm of cryptocurrency, understanding and tracking the intricate web of funds, or “money flow,” is an indispensable skill for investors, traders, analysts, and researchers.
Blockchain technology, while transparent, can be cryptic to navigate. The strings of alphanumeric characters on the blockchain require indexing and interpretation to yield actionable insights. Fortunately, MetaMosaic equipped with Crypto Reference Data, blockchain reference data, and cutting-edge tools, serve as a beacon of clarity in this data-rich yet cryptic environment.
Metamosaic is a platform for blockchain reference data, where everyone can access protocol-centric metadata, classifications, and relation graphs with API and explorer.Metamosaic’s mission is to build a Single Source of Truth (SSOT) for crypto.
Website: https://www.metamosaic.io/
Contact: [email protected]


All Comments