

Bitcoin’s price has reached an all-time high of around $67,500 in November of 2021 before falling to well below the price of $20,000 in 2022. Bitcoin’s price at the time of this writing is $16,848.
The million-dollar question is “when should we buy?”
Before reading further, please keep in mind that this article is not financial advice because the article is me sharing my analysis for entertainment purpose.
Now, let’s get to looking at Bitcoin.
First let’s look at the realized value of Bitcoin.
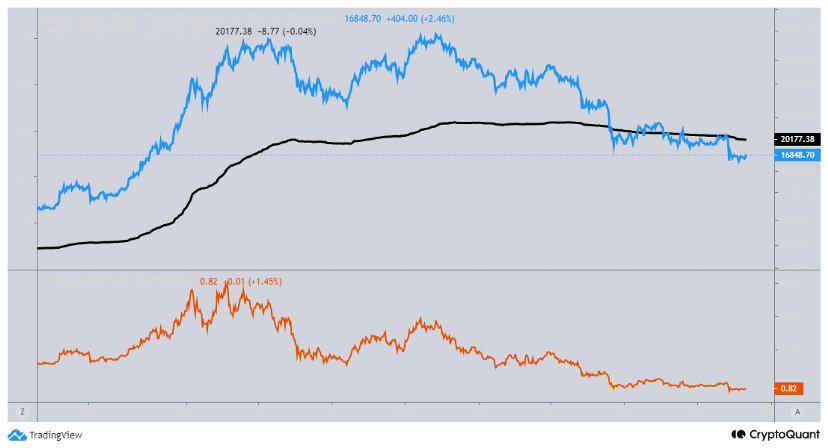
The realized value or realized price is identify by the black line. The blue line on the chart is Bitcoin’s value based on USD. The realized value is the average price of Bitcoin bought by holders. Currently, the realized value of Bitcoin is $20,177.
The current market value of Bitcoin is $16,848.
Now let’s look at the ratio of market value over realized value. aka MVRV ratio (identified by the orange line in the chart above). The value of $16,848 over 20,177 is approximately 0.83. The ratio is less than 1. It means that the market price is 0.83 of the realized value. Or we can say that the market value is approximately 17% lower than the average value of Bitcoin bought by holders. Another way to say this is that the price is at a 17% discount from the average bought price.
Next let’s look at the percentage of profit and loss ratio based on supply and BTC’s UTXO.
In the chart below, the middle panel is the percentage of supplies in profit and losses. The bottom panel is the percentage of supplies in profit and losses based on UTXO. However, I want to focus more on the middle panel. I also highlighted 3 periods in this first chart.
Nov 2018 — Mar 2019, 5-month period
Mar 2020 — Apr 2020, 1-month period
May 2022 — Current, 7-month period and ongoing

These highlighted periods are where the percentage of supplies in profit drops and the percentage of supplies in losses increases. Both the percentage of supplies in profit and losses comes to a point where the meet and overlapped as identified by the yellow box.
Currently, we are seeing this event happen again as Bitcoin’s price has fallen to under $17k.
We care about this metric because historically, when this happens, Bitcoin’s price are at some of its lowest price point of that market cycle.
Now in the bottom chart, let’s look to the period of Aug 2014 to Oct 2015. This period took 14 months where the BTC price dropped from slightly over $1,000 to around the lower $200. It is also where the spent output profit and loss ratio overlapped for 14 months. At the end of this profit nd loss overlapped, the price of BTC started to move upward.
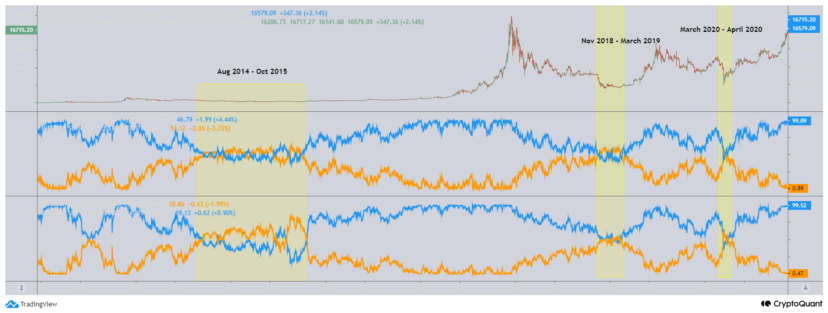
Now that we’ve looked at 4 times in Bitcoin’s history where the percentage of supplies in profit and losses overlapped, we can now see that this normally happens when Bitcoin’s price is around its bottom of that market cycle. I don’t know if the market cycle will repeat because history is not an indication that the future will repeat. But looking at this metric we can say that Bitcoin’s price is extremely attractive when periods like this presents itself.
In conclusion, I covered the market value over realized value and pointed out that the current market value is 17% lower than the realized value. This can be interpreted that the current price is at a 17% discounted price from the average market bought price.
I also covered that the percentage of supplies in profits and losses have overlapped and when this happens in Bitcoin’s history then this normally indicate some of the most attractive Bitcoin price levels.
Currently, there are so many indicators and I only covered 2 of them in this article. In my views, this period may potentially be some of the best time to accumulate Bitcoin during this cycle (assuming that the market cycle that has happened in Bitcoin’s history continues); however, please keep in mind that this article is just my opinion and I am sharing my thoughts based on my analysis. Also, these indicators does not mean that Bitcoin’s price cannot drop. These metrics are more for looking at periods for accumulation rather then making day trading decisions. Again, this article is not financial advice and just my opinions.


All Comments