

Cointime

Download App
iOS & Android

Here’s What the On-Chain Metrics for Bitcoin Spending Has Looked Like This Past Year

In this article, we look at what the on-chain metrics has looked like for Bitcoin spending.

In this first chart below, we look a BTC spending for the following supply distribution group. Each group are separated by tabs.

Holders holding 10–100 BTC

Holders holding 100–1,000 BTC

Holders holding 1,000–10,000 BTC

Holders holding 10,000 + BTC
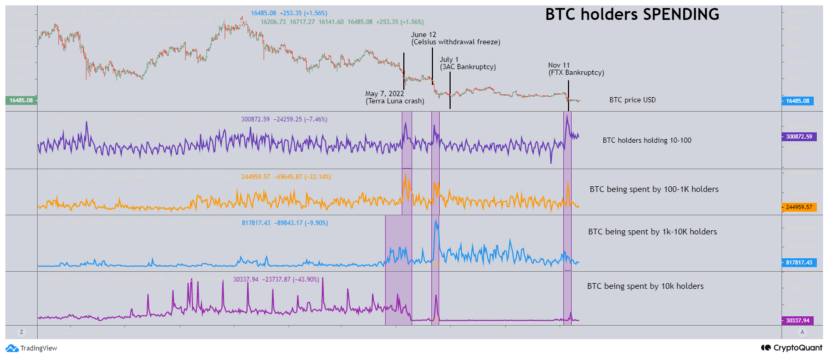
In the light purple box, I highlighted the spending for the following events:

May 7th, Terra LUNA and UST crash

June 12th, Celsius withdrawal freeze

July 1st, Three Arrow Capital Bankruptcy Filing and withdrawal Freeze

November 11th, FTX Bankruptcy filing

Here we can see that spending by all groups spiked during these events. When we see spikes like this, it means that large amounts of BTC have been moved aka spent. When this happened, we can also see that the BTC price also reacted and moved downward in responding to the spike in BTC spending.

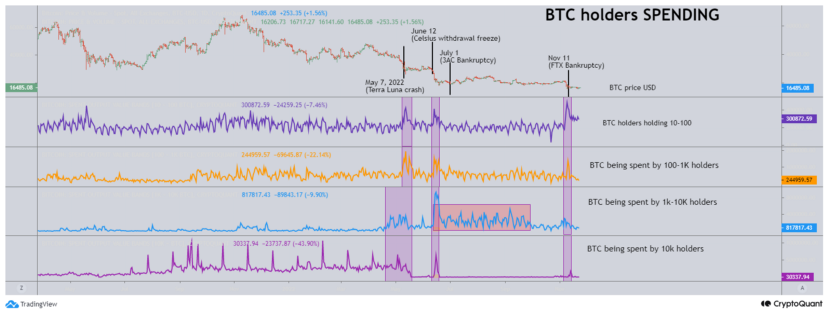
This next chart below, I want to highlight in light red that holders holding 1,000–10,000 BTC was spending their BTC throughout this $20k BTC price this past few months.
Let’s look at the exchange inflows in this next chart below. We can see on here that exchange inflows have spiked multiple times since May 2022. This was also when many of the Bitcoin was being spent by holders holding 1k-10k BTC.
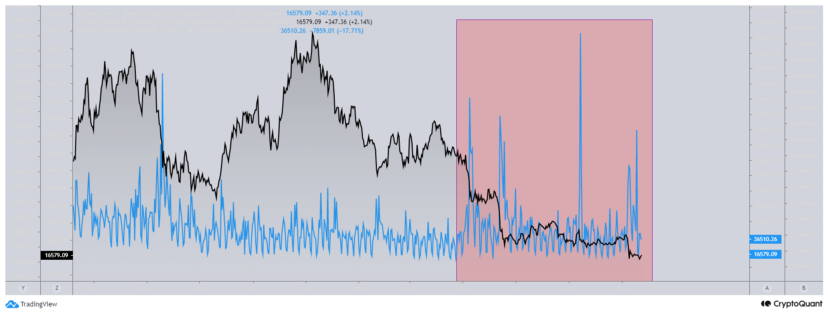
Exchange inflows can be looked at as possible incoming sell pressure. However it is important to keep in mind that sometimes Bitcoin are moved onto an exchange as a place holder rather than to be sold and then moved back off exchanges.

Now, let’s go back further and take a quick look at the May crash of 2021. This is the first purple box on the left of the cart below.

Right when the price started moving downward, we can see spending spiked in the holders holding 10–100 BTC. Because the price moved down, we can assume that the spent Bitcoin was most likely sent onto exchanges to be sold. However, the selling pressure during May 2021 was not due to larger holders holding 100 BTC or more. Instead, it was smaller holders spending their BTC.

But then, let’s look at what happened during the second bull run of the second half of 2021.
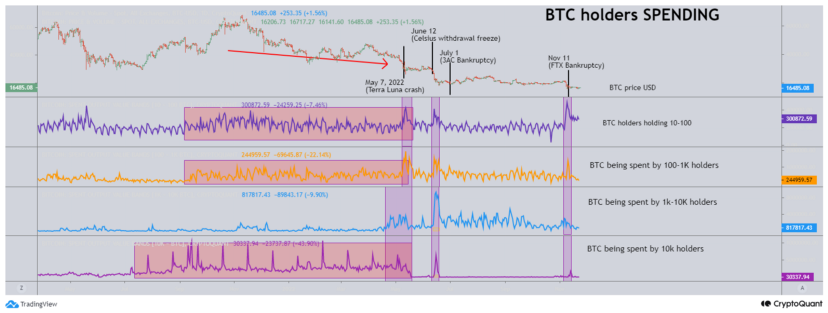
We can see that as price moved up, we can see that the spending by holders holding 10–100 BTC, holders holding 100–1,000 BTC and holders holding 10,000 + BTC were being spent. As this continue, eventually, the price of Bitcoin started to move downward. Everything is hindsight now, but the heavy spending was the indicator that the top was in and a reversal was coming.

Why is the metric Bitcoin Spending important?

Here’s why looking at Bitcoin spending is important. Normally when large amounts of Bitcoin are spent, then there’s normally some price action that reflects it. In the case of this past year, Bitcoin’s price has moved down as a response to Bitcoin spending spiking up. When BTC spending slowed down as it did after the May 2021 crash then that allowed Bitcoin’s price to move up. This is because less spending causes less sell pressure leading to less available supply on the market. If demand goes up, then it means more holders will accumulate. Because less available supply is in the market due to less spending then price moves up due to demand from buyers, this therefore increases the value of Bitcoin.

In short, in most situations, if spending goes down then the value of Bitcoin goes up. If spending goes up then more often, the value of Bitcoin goes down in response. Due to this, BTC spending is one of the many important metric to look at.

This article is not financial advice and is me sharing what my analysis of BTC based on its spending metric. Going forward, what I’ll be looking for is for the BTC spending metric to slow down for a good period of time. This lets me know that everyone who are looking to spend their BTC has already done so.


BTC
Comments

All Comments

Recommended for you

  • BTC Surpasses $81,000

    Market data shows that BTC has surpassed $81,000, currently priced at $81,002, with a 24-hour decline of 2.94%. The market is experiencing significant volatility, so please ensure proper risk management.

  • US Spot Bitcoin ETF Sees $261.4 Million Net Outflow Yesterday

    On October 15, according to monitoring data from Farside Investors, the US spot Bitcoin ETF experienced a net outflow of $261.4 million yesterday.

  • Over $476 Million Liquidated in the Last Hour, Primarily Long Positions

    Data shows that in the past hour, a total of $476 million was liquidated across the network, with long positions accounting for $457 million and short positions for $19.7945 million, primarily affecting long positions. Among these, $200 million in ETH and $116 million in BTC were liquidated.

  • ETH Falls Below $2400

    Market data shows that ETH has fallen below $2400, currently priced at $2395.62, with a 24-hour decline of 4.47%. The market is experiencing significant volatility, so please ensure proper risk management.

  • BTC Drops Below $81,000

    Market data shows that BTC has fallen below $81,000, currently priced at $80,989.9, with a 24-hour decline of 2.87%. The market is experiencing significant volatility, so please ensure proper risk management.

  • US Considers Easing Sanctions on Shadow Fleet to Lower Shipping Rates

    On October 15, a US official stated on Wednesday that the Trump administration is considering easing sanctions on vessels known as the 'shadow fleet.' These ships have previously transported oil and petroleum products from countries such as Russia, Iran, and Venezuela. This move aims to reduce the currently historically high global shipping rates. Shortly before this, President Trump had temporarily lifted sanctions on Russian diesel, a decision that drew strong criticism from Ukrainian President Zelensky, several European governments, and some Republican senators. The US official revealed that current discussions focus on whether the US will allow previously sanctioned vessels to transport 'legitimate oil.' Here, 'legitimate oil' refers to crude oil or petroleum products not subject to US sanctions, rather than oil from Russia and Iran that is under sanctions. The official stated that this move aims to facilitate the export of more refined products and crude oil from the Gulf region.

  • Dollar Index Erases All Gains Since CPI Report Release

    On October 15, the Dollar Index (DXY) slowly declined in the Asian session, completely erasing all gains since the release of the U.S. September CPI data yesterday (which had peaked with a cumulative increase of about 70 points), now reported at 102.16. The British Pound against the U.S. Dollar (GBP/USD) and the Euro against the U.S. Dollar (EUR/USD) both rose about 0.3%, currently reported at 1.3231 and 1.1197, respectively. (Jin10)

  • BTC falls below $67,000

    market shows BTC has fallen below $67,000, currently reporting at $66,987.51, with a 24-hour increase of 0.41%. The market is experiencing significant fluctuations, please be prepared for risk control.

  • BTC breaks through $67,000

    the market shows BTC has broken through $67,000 and is currently trading at $67,011.99, with a 24-hour decline of 0.26%. The market is volatile, so please be prepared to manage risks.

  • Crypto Options Traders Bet on Bitcoin to Reach Fresh Highs by End of November

    According to Bloomberg, options traders in the crypto market are increasingly betting on bitcoin reaching new highs by the end of November. The $75,000 strike price has the highest open interest for options expiring on November 8, indicating a significant area of focus for the market during that time. Despite the upcoming U.S. presidential election, some traders believe that bitcoin will surpass its previous highs in the coming weeks. The rise in stablecoin liquidity and bitcoin transactions in October may contribute to this bullish sentiment.