


Key Points:
- Bitcoin halving is a key event that has played a role in the past 3 cycles.
- On the average, bitcoin bottoms usually occur around 70 weeks from each bitcoin halving cycle, and the last local bottom is 76 weeks leading to the projected fourth halving in April 2024 which could mean that $15K level back in November 2022 is more likely a bottom candidate as the pattern on the past 3 cycles suggest.
- Past 3 cycles were all parabolic and parabolic declines usually have an average degree correction, but while first 2 cycles went close to that mark, the recent third cycle failed to reach it.
Hello traders, last time we did an analysis on bitcoin’s fundamentals with the intent to project its future value. This was the first part of the three topics we will cover.
The analysis we derived from that part will be incorporated in this portion which is another fundamental analysis that will cover the market cycles of bitcoin and its halving cycles.
These will form part of our broader projection on bitcoin price in its fourth cycle.
Market cycles refer to the recurring patterns of growth and decline in the price of an asset over time. These cycles are characterized by periods of sharp price increases, known as bull markets, followed by periods of significant price declines, known as bear markets.

In the case of bitcoin, each cycle typically starts with a period of low prices, followed by a gradual increase in price as more people become interested in Bitcoin. As demand for Bitcoin increases, the price begins to rise more rapidly, leading to a period of rapid growth and excitement among investors. This growth eventually reaches a peak, which is followed by a period of decline as investors begin to take profits and the market corrects itself.
The peak of each cycle is typically marked by a frenzy of buying and media attention, followed by a significant sell-off and a period of consolidation. The cycle then repeats itself, with a new period of growth eventually leading to a new peak.
There have been three cycles of Bitcoin Bull and Bear Market,
First Bitcoin Cycle was Year 2011–2014:
The first Bitcoin cycle began in 2011, and was largely driven by the novelty and excitement surrounding the technology. At the time, Bitcoin was seen as a unique and innovative solution to many of the problems facing traditional financial systems, and early adopters were attracted to the potential for decentralization and degree of anonymity that it offered.
As demand for Bitcoin grew, the price began to increase, eventually reaching a peak of around $1100 in April 2013. However, the cycle saw significant volatility and regulatory uncertainty, which contributed to its eventual decline. The collapse of the popular Bitcoin exchange Mt. Gox in early 2014, the largest Bitcoin exchange in the world at the time, along with increased regulatory scrutiny, led to a significant sell-off and a prolonged bear market.
Second Bitcoin Cycle was Year 2015–2018
The second Bitcoin cycle began in late 2013, after a long bear market during the first cycle. The 2nd cycle was characterized by a rapid increase in demand and price. This cycle was largely driven by increased mainstream interest in Bitcoin, as well as the emergence of new use cases and applications for the technology.
Some of the key factors that contributed to the growth of the second cycle included:
- Increased adoption and acceptance by merchants and businesses.
- The emergence of new blockchain-based applications and platforms.
- Increased investment and institutional interest in Bitcoin.
The second cycle eventually peaked in late 2017, with Bitcoin reaching an all-time high of around $19,000. However, the cycle was also characterized by significant speculation and hype, which ultimately contributed to its decline. As investors began to take profits and regulatory scrutiny increased, the price of Bitcoin began to fall, leading to a prolonged bear market. The second cycle dip in 2017–2018 was triggered by SegWit debates, in an attempt to make bitcoin more scalable and environmentally sustainable. The Great Crypto Crash caused the price of Bitcoin to fall by about 84%.
Third Bitcoin Cycle was Year 2019–2022:
The third Bitcoin cycle began in late 2018 and was characterized by a significant increase in demand and price, driven largely by increased institutional interest and speculation.
Some of the key factors that contributed to the growth of the third cycle included:
- Increased institutional adoption and investment, including the launch of Bitcoin futures contracts on major exchanges.
- Increased mainstream media attention and public awareness.
- The emergence of new use cases and applications, such as decentralized finance (DeFi) and non-fungible tokens (NFTs).
The third cycle peaked in Nov 2022, with Bitcoin reaching an all-time high of around $68000. However, the cycle was also characterized by significant volatility and speculation, which ultimately contributed to its decline. The third cycle saw a broad selloff which was partially driven by concerns over regulatory crackdowns in China and increased scrutiny from global regulators particularly the SEC’s announcement of regulations on crypto agencies and the Federal Reserve’s interest rate hike, as well as concerns over Bitcoin’s environmental impact led to the largest crypto crash ever.
Each Bitcoin cycle has been driven by a combination of factors, including increased adoption, innovation, institutional investment, and media attention. However, each cycle has also been characterized by significant volatility and regulatory uncertainty, which has contributed to their eventual decline.
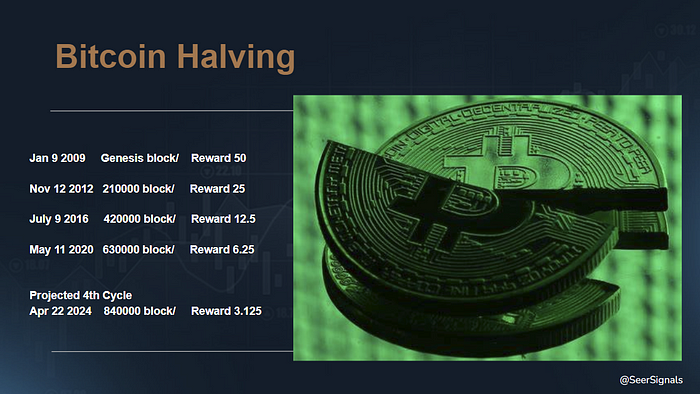
Bitcoin halving is a key event that has played a role in each cycle.
What is Bitcoin Halving?
Bitcoin, like other decentralized blockchain networks, relies on a consensus mechanism called Proof of Work to validate transactions and secure the network.
In Proof of Work, miners compete to solve complex mathematical problems to add new blocks to the blockchain, and the miner who solves the problem first gets to add the next block and receive a reward in bitcoin..
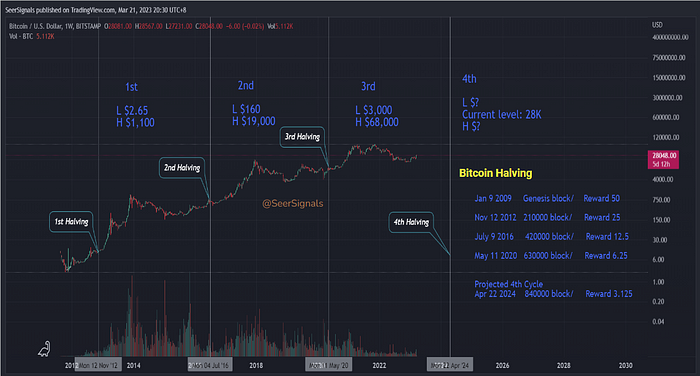
Bitcoin Halving refers to the process of reducing the rate at which new Bitcoins as mining rewards are created, which occurs approximately every four years.
The first Bitcoin halving took place in 2012, when the block reward was reduced from 50 bitcoins to 25 bitcoins.
The second halving occurred in 2016, when the reward was reduced from 25 bitcoins to 12.5 bitcoins.
The most recent halving occurred on May 11, 2020, when the block reward was reduced to 6.25 bitcoins.
The next halving is expected to occur on April 22, 2024 which would reduce the block reward to 3.125
During each cycle, the halving event has been followed by a period of increased demand for Bitcoin, leading to price increases that eventually peak and reverse. The exact timing and magnitude of these movements can vary, but the halving event has historically been a significant driver of Bitcoin cycles. The halving event has played a role in each cycle, impacting the supply and demand dynamics of Bitcoin and potentially leading to price increases.
Halving Impact on Bitcoin’s Market Cycle
Now on to the most important part, let’s measure the time distance from each cycle bottom to bitcoin halving dates.
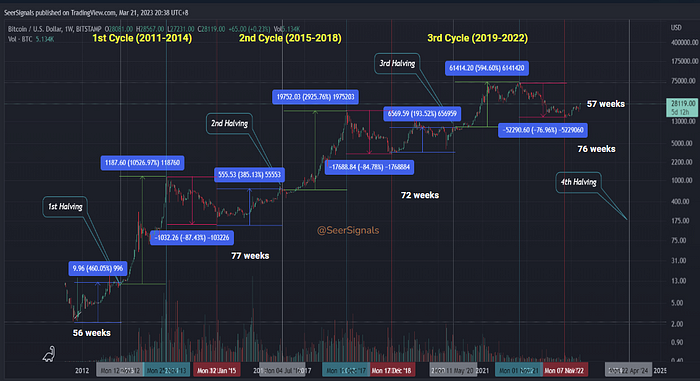
The first cycle bottom to first halving was 56 weeks, on the 2nd cycle, the bottom was 77 weeks to second halving, and on the 3rd cycle, the bottom was 72 weeks to 3rd halving.
Our last local bottom is 76 weeks to the fourth halving in April 2024. The current price candle is 57 weeks away from the next halving.
Common sense will tell you that from the data points of halving dates, the 15k level which we reached back in November 2022 is more likely a bottom candidate.
We can compare this to the time distance of each cycle peaks to cycle bottoms and we can more or less get a similar impression.
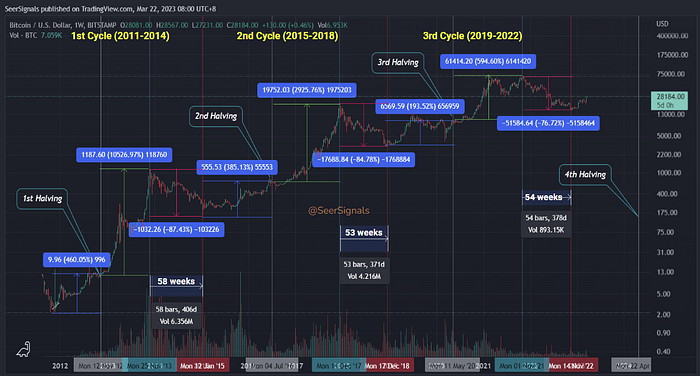
The first cycle peak was 58 weeks away from the 2014 bottom, the second was 53 weeks away from 2018 bottom and currently the 3rd cycle peak back in November 2021, is 54 weeks to the most recent bottom which was in November 2022 at 15K level.
Judging by the patterns we saw on the past 3 cycles and the bullish fundamentals, it’s quite tempting to assume that since we have established similar patterns of ups and down over the last 3 cycles, It would safe to say that we have likely bottomed already and can deduce that we will likely break all time high like it did in the past. We know that there are a lot of people out there calling for higher bitcoin prices like $300K and $1 M.
But the market isn’t that simple.
What worked in the past 3 cycles is not a guarantee that it will work similarly this time.
While this analysis could be as bullish as it did in our first fundamental analysis, it’s best to compare these data points with more chart data.
Bitcoin Cycle Dips
Also worth paying attention to is the degree of price declines from each cycle peaks.
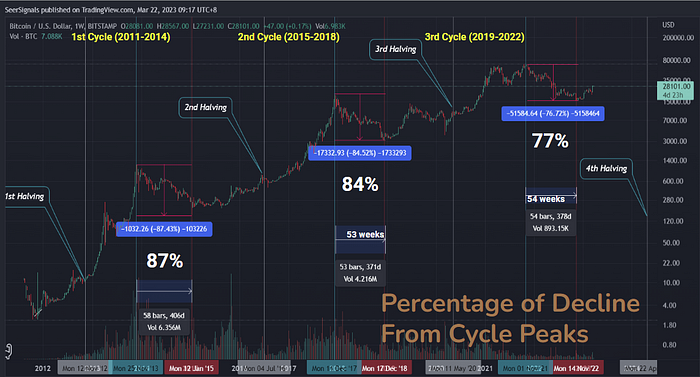
The first cycle had 87%, the second had 84% and the 3rd and most recent had only 77% which gives a layer of complication as all 3 cycles looked parabolic in the linear chart.
Parabolic Curves tend to have 85% declines on the average after the curve gets broken and clearly, the recent decline has not yet achieved its downward target.
In simple terms, we are more likely still in a longer term downtrend as we have not yet completed the downward target in the current trend.
Market moves in fractals and to make sure we consider all angles, we will try to count each cycle wave to project the Elliott wave count using 2 charts, the logarithmic and linear chart in our next discussion.
This will show you what I call the current bitcoin dilemma. From there we will try to project our fourth cycle considering all the angles we have already discussed. See you guys next.


All Comments