

From paradigm Joe Clark, Andrew Leone, Dan Robinson
We’ve been thinking a lot about power perps. Power perps are assets that target the power of an index price, like index2 or index3. It’s a fun rabbit hole to go down. The longer you think about power perps, the more you see how everything resembles a power perp.
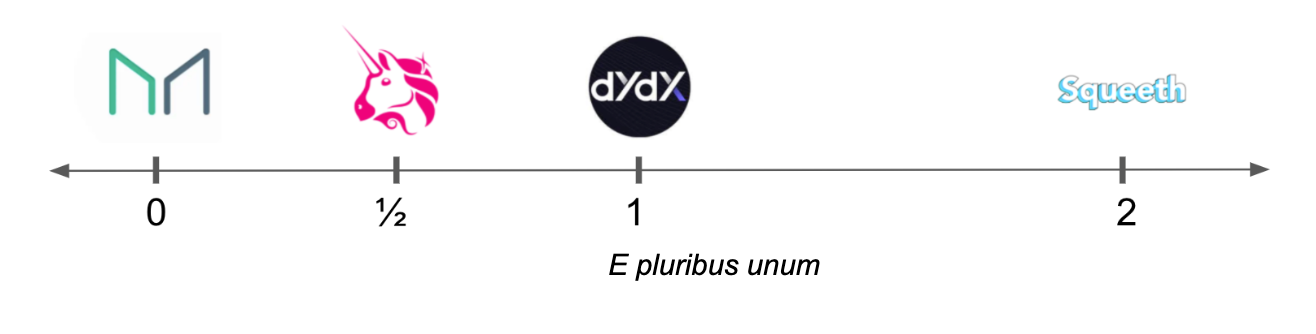
Here we make three surprising claims:
- Crypto-collateralized stablecoins (like DAI or RAI) are like 0-perps.
- Margined futures (like dYdX) are 1-perps.
- Constant product AMMs like Uniswap are a replicating portfolio for a 0.5-perp, and constant geometric-mean AMMs like Balancer are replicating portfolios for power perps for any value between 0 and 1.
This is cool because it reveals a surprisingly compact design space across three of the main primitives in DeFi. Let’s have a look at each one, but first we need a definition of perps and power perps.
Definition: A perpetual is a contract that tracks and gives exposure to an index1, and exchanges regular payments that are larger the further the traded price (mark) is away from the target price (index). (See The Cartoon Guide to Perps for a more detailed explanation.)
Graphically, the funding payment varies with the area between the mark and index price over a funding period (see figure). If the mark price is above the index, longs pay shorts. If the mark price is below the index, shorts pay longs.
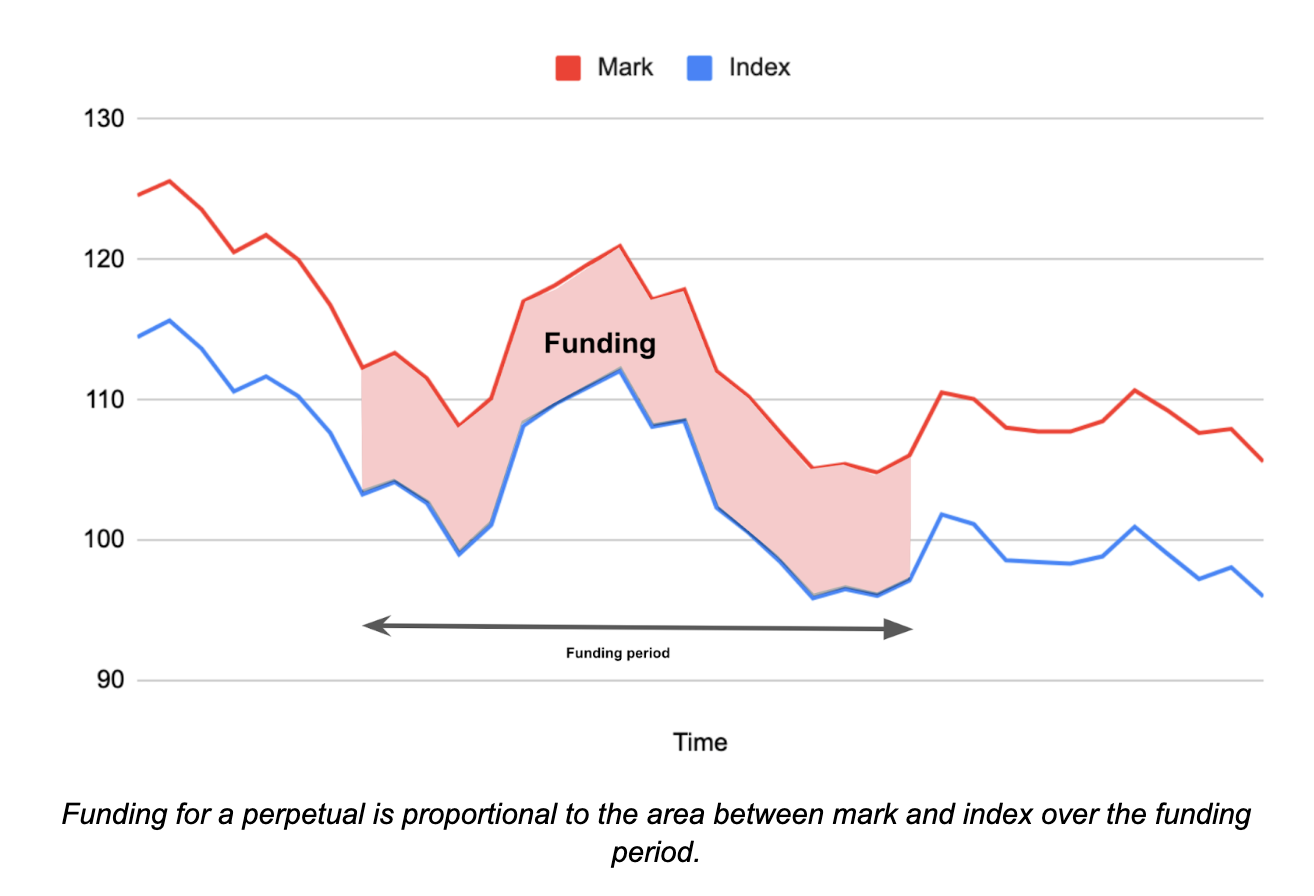
There are various mechanisms to transfer funding payments (e.g., cash or in-kind payments, periodic or continuous funding, automatic or by governance, etc.), and various mechanisms to set interest rates based on prices (including proportional mechanisms like used by Squeeth and the more complex PID controller used by Reflexer). All mechanisms implement the idea that longs should pay shorts when mark is higher than index, and vice versa.
Definition: A power perpetual is a perpetual with index price^p for some power p.
To create a short position in a power perpetual contract, lock some collateral in a vault and mint (i.e. borrow) some power perpetual. Sell this minted power perpetual to go short. To go long, buy from whoever owns some.
The mechanics are driven by the required ratio of collateral to debt:
Collateral ratio = Equity/Debt = ((collateral quantity) * (collateral price)) / ((perpetual quantity) * (index asset price)^p )
This ratio must be kept safely above one so there is enough collateral to cover the debt, otherwise the contract liquidates the collateral by buying enough perps to close the position.
A design space for power perpetuals
A design space for power perpetuals involves the power p, the minimum collateral ratio c>1, and three asset choices:
- Collateral asset: e.g., USD
- Index asset (the asset whose value is being tokenized): e.g., ETH
- Numeraire asset(the unit in which we measure the value): usually USD
Now to our three claims.
Claim 1: Stablecoins are 0-perps
A stablecoin is a loan of a minted token against reliably priced collateral. The following configuration gives a USD stablecoin:
- Collateral asset: ETH
- Index asset: ETH
- Numeraire asset: USD
- Collateral ratio: 1.5
- Power: 0
This means that we are posting ETH collateral and minting a stablecoin token. The index is the price of ETH raised to the zeroth power, which is just one as ETH^0 = 1.
If I deposit 1 ETH as collateral, and ETH is trading at 3000, I can mint up to 2000 tokens. This gives 1.5x collateral:
Collateral ratio = Equity/Debt = ((collateral quantity) * (collateral price)) / ((perpetual quantity) * (index asset price)^p )= 1 * 3000/ (2000 * 1) = 1.5
Funding is the prevailing traded price of the stablecoin in USD (mark) minus the target index price^0.
Funding = Mark - Index = Mark - price^0 = Mark - 1
The funding mechanism gives good incentives for the stablecoin to trade close to $1. If it trades materially above $1 it will be profitable to sell any stablecoin you hold, then mint and sell even more, and receive funding. If it is below $1, it pays to buy the stablecoin to earn a positive interest rate and potentially sell it at a higher price in the future.
Not all stablecoins in the wild use this exact (mark - index) funding mechanism, but all collateralized stablecoins share this basic structure, minting stablecoins as a loan against good collateral. Even stablecoins with governance-set interest rates will set these at something like mark - 1 to keep their peg to $1.
Claim 2: Margined futures are 1-perps
If we modify the stablecoin in the previous section to have a power of 1, and change the collateral to USD, we get a tokenized ETH asset:
- Collateral asset: USD
- Index asset: ETH
- Numeraire asset: USD
- Collateral ratio: 1.5
- Power: 1
I put down 4500 in USD collateral with ETH trading at 3000 and mint one stableETH token.
Collateral ratio = Equity/Debt = ((collateral quantity) * (collateral price)) / ((perpetual quantity) * (index asset price)p ) = 4500 *1 / (1 * 30001) = 1.5
Funding for this perp is the traded price of the perp in USD (the mark price) minus the target index price^1.
Funding = Mark - Index = Mark - price^1 = Mark - ETH/USD price
The funding mechanism gives good incentives for the perp to trade close to the ETH price. If the price is substantially higher, funding will encourage arbitrageurs to buy the asset and short the perpetual. If it is substantially lower, it will encourage them to short sell the asset and buy the perpetual. There is a precise replication argument for what Mark should be based on expiring instruments that offer exposure to ETH prices (see the paper on Everlasting Options).
I can sell this stableETH asset to go short the price of ETH, backed by USD collateral.
Going from tokenized short asset to margined short perpetual
The stableETH asset we have constructed is not very capital efficient. We put up $4500 in collateral to get short $3000 (or 1 ETH) worth of exposure to ETH. We can make it more capital efficient by selling the token for a USD stablecoin and then using this as collateral to mint more of the perpetual.
If the minimum collateral ratio is 1.5 and ETH is 3000 we have the following sequence:
- Deposit $4500 and mint 1 stableETH
- Sell stableETH for $3000, deposit proceeds, and mint 1/1.5 = 0.666 stableETH
- Sell stableETH for $2000, deposit proceeds, and mint (1/1.5)^2 = 0.444 stableETH
- Sell stableETH for = $1333.33, deposit proceeds, and mint (1/1.5)^3 = 0.296 stableETH
- etc2
Summing up the transactions, we end up minting and selling 3 stableETH. This is $9000 of short ETH exposure from $4500 collateral. This position is equivalent to opening a 2x leveraged short ETH/USD perp.
If we have access to flash swaps or flash loans, this process is simplified. We can flash swap 3 stableEth for USD and use the proceeds as collateral to mint the stableETH to repay.
If the collateral requirement was 110% we could have made a 10x position.
Going long instead of short
To go long, buy this stableETH in exchange for USD. To leverage long, borrow more USD using the stableETH collateral and use that borrowed USD to buy more stableETH, then borrow more USD and repeat the process up to 2x ETH. If flash swaps or flash loans are available, this can be done in a single transaction.
All of this means that overcollateralized perpetuals backed by more than 100% collateral can be converted into undercollateralized perp futures like those traded on dYdX.
Claim 3: Uniswap and other constant product CFMMs are (almost) a 0.5 perp
A liquidity position in a Uniswap pool has a value proportional to the square root of the relative price of the two assets. For a full range LP in the ETH/USD pool the value of the LP is
V = 2 * (k * (eth price))^0.5
Where k is the product of the amount of the two tokens. The pool generates some amount of trading fees per period.
Now consider the perp:
- Collateral asset: USD
- Index asset: ETH
- Numeraire asset: USD
- Collateral ratio: 1.2
- Power: 0.5
This perp will track the value of price^0.5, mirroring the payoff of the AMM.
A portfolio short units of the perpetual and the LP will receive the difference between the perp funding and the AMM fees. Since this trade offsets the price risk, the 0.5 perp should trade below by exactly:
Expected Uniswap fees = Index - Mark
The extension to Uniswap v3 is straightforward and left to the reader ;)
This gives us a nice result that the equilibrium Uniswap fee3 should be the funding rate for a 0.5 perpetual. In the simplified case with zero rates this is
Equilibrium uniswap return = σ²/8
Where σ² is the variance of the price returns of one pool asset against the other. We also get this result purely from a Uniswap perspective (see appendix C here for a more direct construction). We also go into detail from a power perp perspective here.
| Collateral | Index | Numeraire | Power | |
| USD stablecoin | ETH | ETH | USD | |
| Overcollateralized future | USD | ETH | USD | 1 |
| Synthetic uniswap | USD | ETH | USD | 0.5 |
| Squeeth | ETH | ETH | USD | 2 |
Everything is a power perpetual
Power perps all the way down
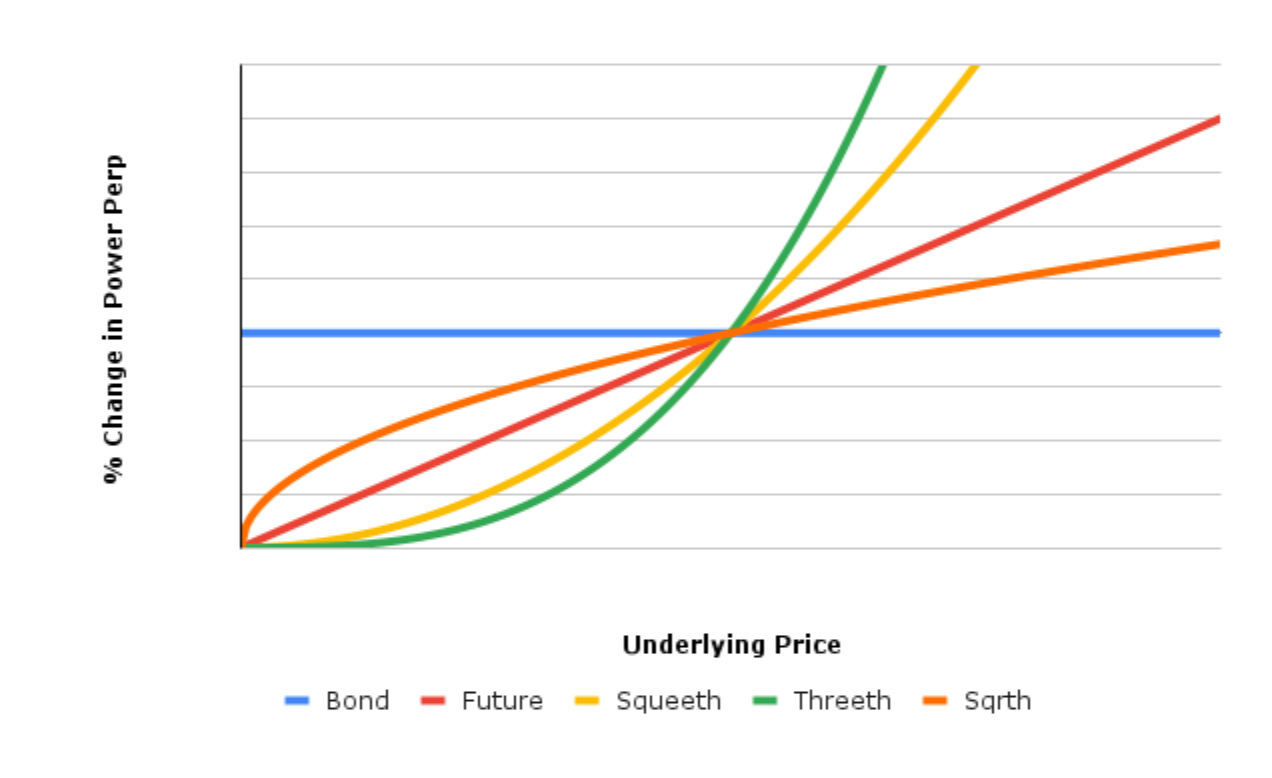
So stablecoins (and collateralized loans more broadly), margined perpetual futures, and AMMs are all a type of power perpetual.
What’s missing?
Higher order power perpetuals — starting with quadratic power perpetuals. Squeeth, the first quadratic power perpetual, provides pure exposure to the quadratic component of price risk. We can get a good approximation of many payoffs by combining higher order power perpetuals and 1-perps (futures) with 0-perps as collateral.
If we need to be more precise, we can use a portfolio of power perps with whole number powers in the weights of a Taylor series to approximate any function: sin(x), ex2, log(x) – whatever you like.
What’s next?
A world that allows power perpetuals, collateral assets, and Uniswap LPs to play nicely together might be really fun.
Footnotes
- An index is often a price, but could be anything that is measured as a number, like the average temperature in San Francisco, or the number of giraffes alive today. ↩
- More generally, the leverage is 1/c^i for i from i=0, so in our case 1/(1.5-1)=2x. In most cases, the multi-step process can be replaced by a single flash swap (e.g., if the perp is traded against its collateral asset in a Uniswap v3 pool). ↩
- Practically, this means that if annualized volatility of the pair is 90% you need to receive 1/8 * 0.9^2 = 10.125% return from fees on your LP. So if you have $100 in a full range Uniswap LP you need to earn $0.028 per day in fees to pay for impermanent loss. This is replicated by a 0.5 perp with a funding rate of 2.8bps per day. ↩


All Comments