


Bitcoin has been trading in a tight range for the past three days, even with the S&P 500 falling for the last four days of the week. This is a positive sign, as it shows that cryptocurrency traders are not panicking and rushing to the exit.
Bitcoin’s supply seems to be gradually shifting to stronger hands. Citing Glassnode data, analyst CryptoCon said that Bitcoin’s short-term holders (STHs) — investors who have held their coins for 155 days or less — are holding the least amount of Bitcoin supply in more than a decade.

In the short term, the uncertainty regarding Bitcoin’s next directional move may be keeping traders at bay, and could be one of the reasons for the subdued price action in several large altcoins. However, it’s not all negative across the board, with several altcoins are showing signs of recovery in the near term.
Could Bitcoin shake out from its slumber and start a bullish move in the near term? Would that act as a catalyst for an altcoin rally? Let’s look at the charts of the top-five cryptocurrencies that may lead the charge higher.
Bitcoin price analysis
The bulls have managed to sustain Bitcoin’s price above the 20-day exponential moving average (EMA) of $26,523, but they have failed to start a strong rebound. This indicates a lack of demand at higher levels.
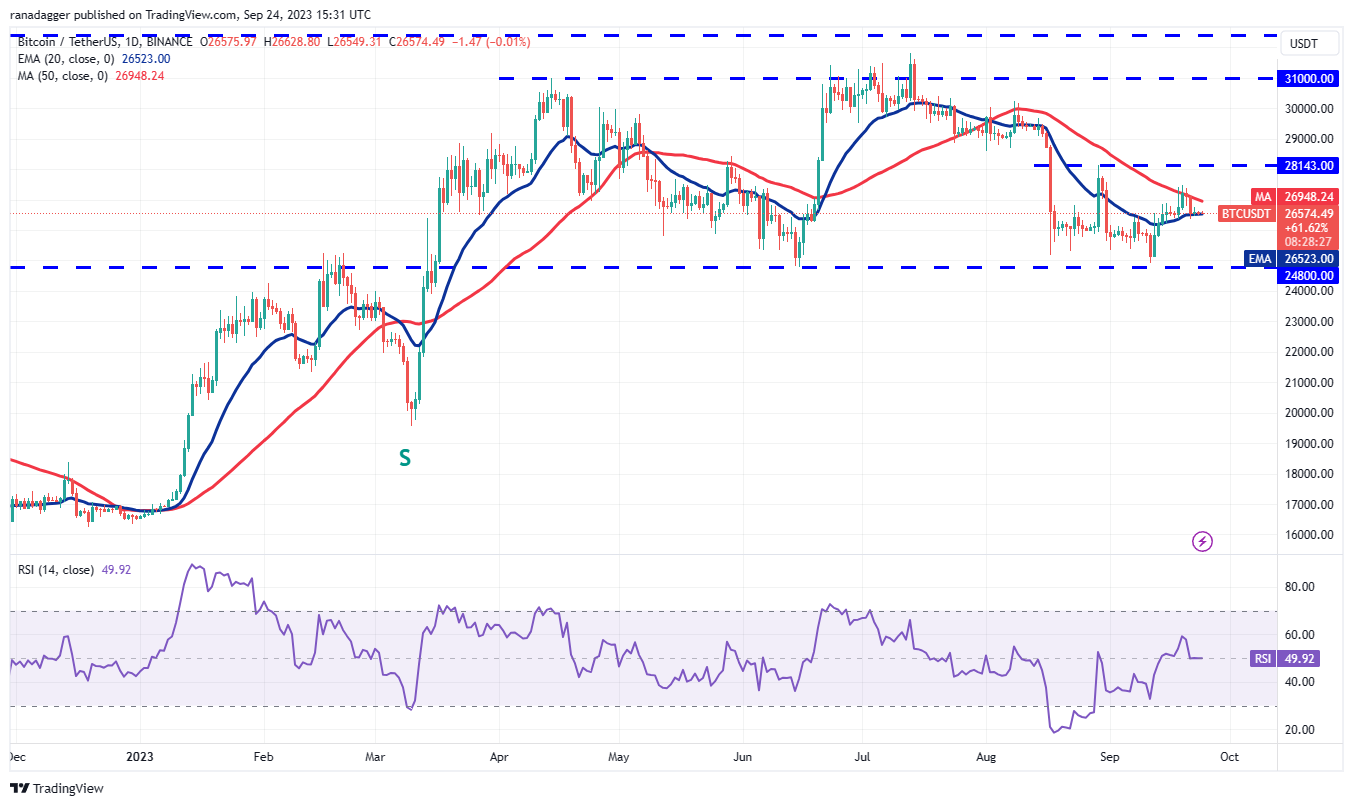
The flattish 20-day EMA and the relative strength index (RSI) near the midpoint show a status of equilibrium between the buyers and sellers. A break below the 20-day EMA will tilt the advantage in favor of the bears. The BTC/USDT pair could then descend to the formidable support at $24,800.
Alternatively, if the price rises from the current level and climbs above the 50-day simple moving average of $26,948, it will signal that buyers are back in the driver’s seat. The pair may then attempt a rally to the overhead resistance at $28,143.
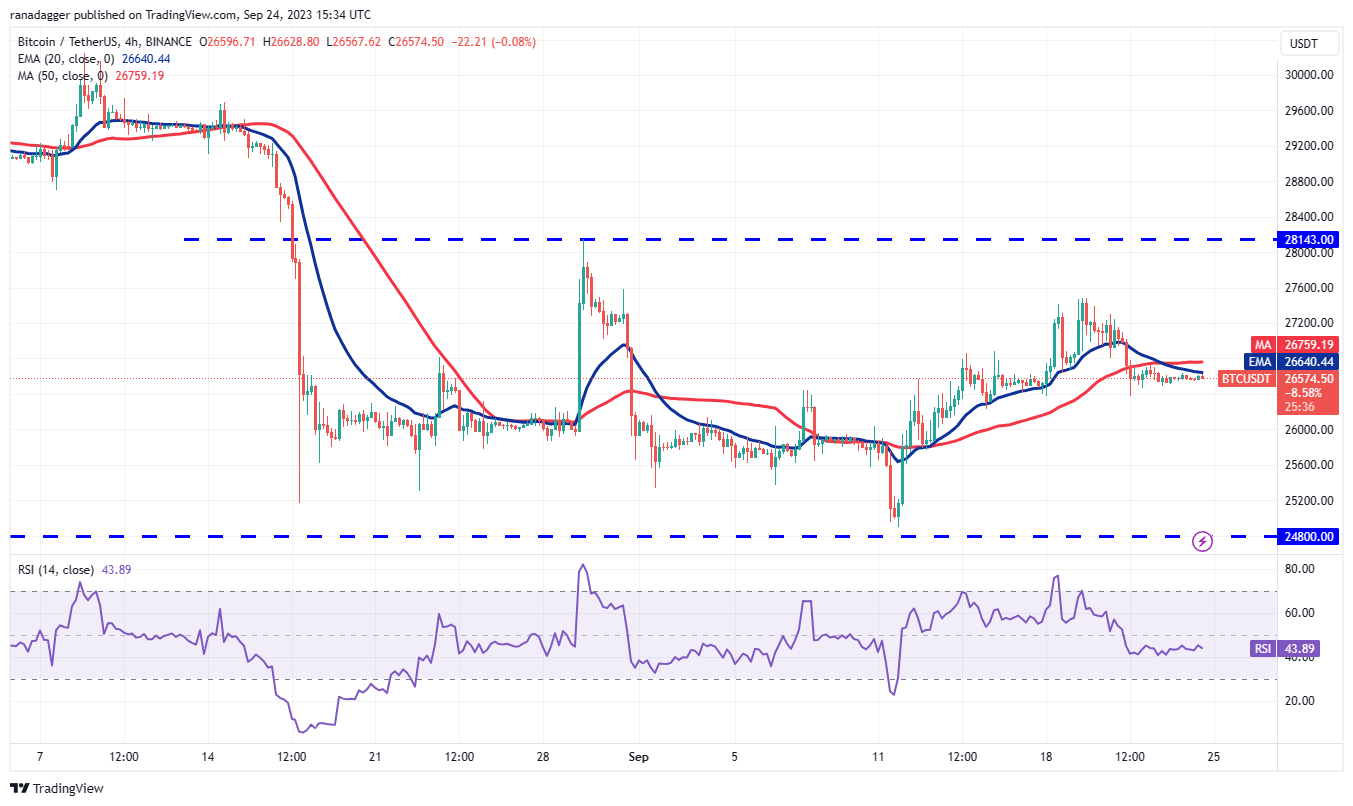
While BTC has been trading below the moving averages on the 4-hour chart, the bears have failed to start a downward move. This suggests that selling is drying up at lower levels. Meanwhile, the bulls will try to propel Bitcoin’s price above the moving averages. If they manage to do that, the pair could rally to $27,400 and subsequently to $28,143.
If the bears want to seize control, they will have to sink and sustain BTC’s price below $26,200. That could first yank it down to $25,750 and then to the $24,800 support level.
Chainlink price analysis
Chainlink surged above the downtrend line on Sept. 22, indicating a potential trend change in the near term.
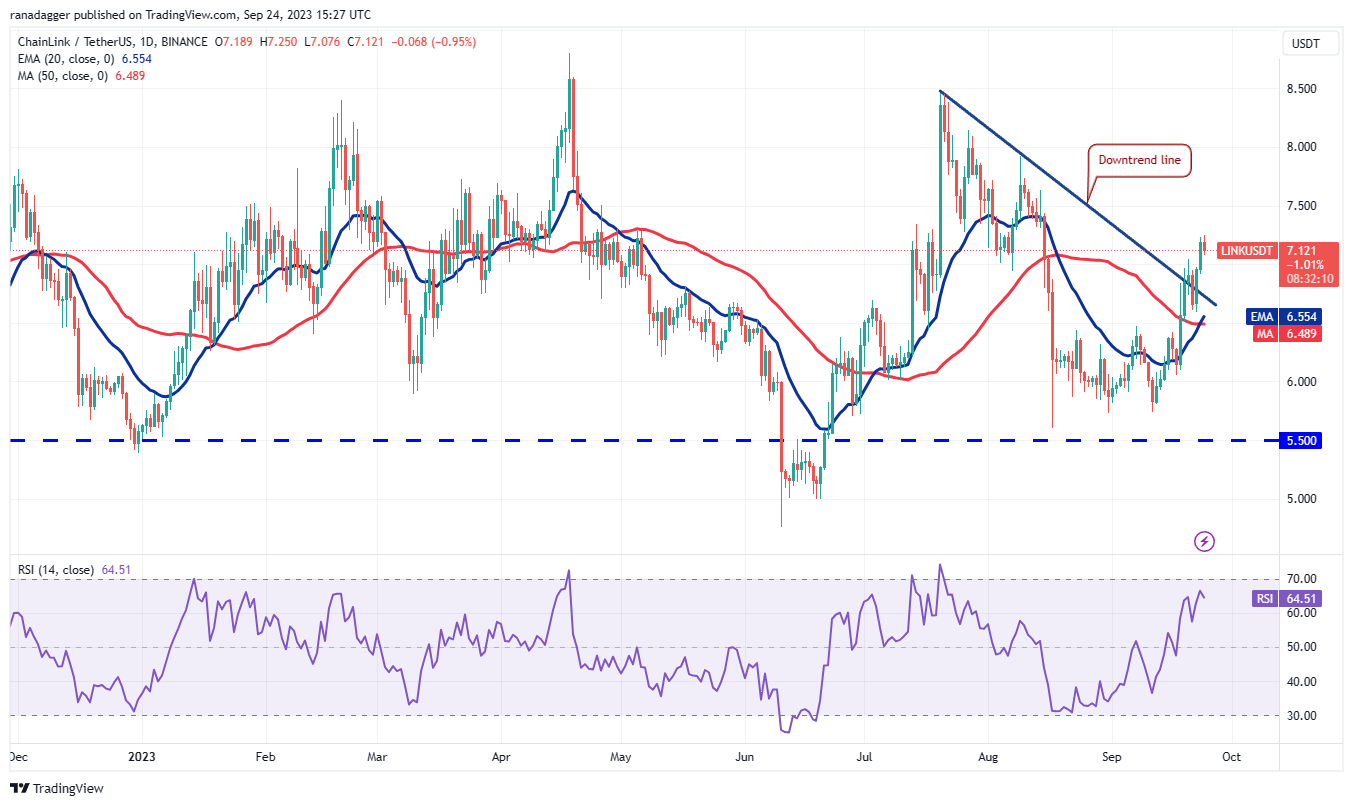
The moving averages have completed a bullish crossover and the RSI is in positive territory, indicating that the buyers have the upper hand. On any correction, the bulls are likely to buy the dips to the 20-day EMA of $6.55. A strong rebound off this level will suggest a change in sentiment from selling on rallies to buying on dips.
The bulls will then try to extend the up-move to $8 and eventually to $8.50. If the bears want to prevent tha up-move, they will have to sink and sustain the LINK/USDT pair below the 20-day EMA.
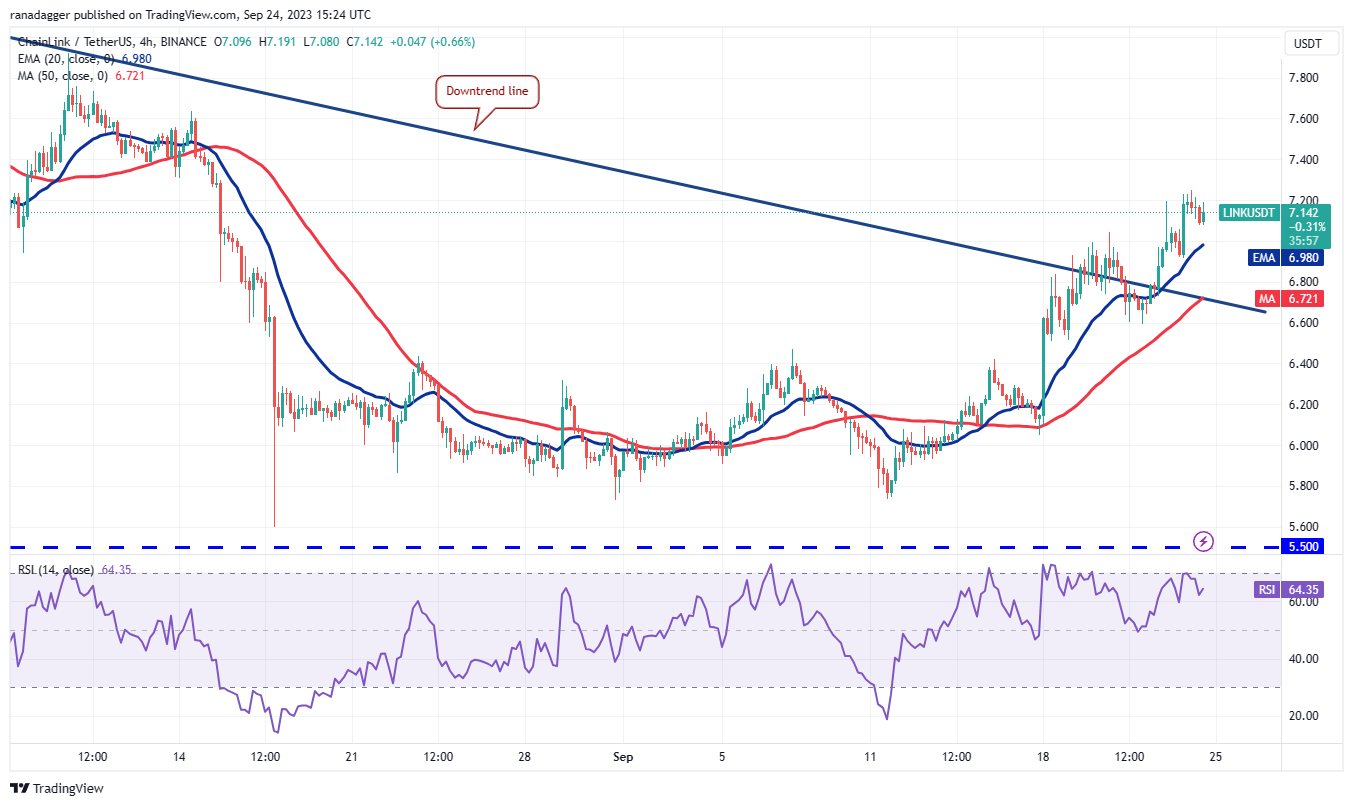
LINK/USDT 4-hour chart. Source: TradingView
Both moving averages are sloping up on the 4-hour chart and the RSI is in the positive zone. The bulls have been buying the dips to the 20-EMA, indicating a positive sentiment. If LINK’s price rebounds off the 20-EMA, $7.60 will then be the upside target to watch.
Contrary to this assumption, if Chainlink’s price continues lower and skids below the 20-EMA, it will signal profit-booking by the bulls. LINK may then retest the breakout level from the downtrend line. The bears will have to sink it below $6.60 to be back in control.
Maker price analysis
Maker turned down from the overhead resistance at $1,370 on Sept. 21, indicating that the bears are trying to defend the level.

The 20-day EMA of $1,226 is the support to watch for the downside. If the price rebounds off this level, it will suggest that lower levels are continuing to attract buyers. The bulls will then make one more attempt to drive MKR’s price above the overhead resistance. If they can pull it off, the MKR/USDT pair could accelerate toward $1,759.
Conversely, if the bears sink the price below the 20-day EMA, it will suggest that the bullish momentum has weakened. That could keep the pair range-bound between $980 and $1,370 for a few days.

The moving averages on the 4-hour chart have flattened out and the RSI is just below the midpoint, indicating a balance between supply and demand. If buyers shove the price above $1,306, the MKR price could sprint toward $1,370.
Instead, if the price turns down and breaks below $1,264, it will suggest that the selling pressure is increasing. That could clear the path for a further decline to $1,225. A slide below this support may tilt the short-term advantage in favor of the bears.
Arbitrum price analysis
Arbitrum (ARB) is in a downtrend. The bears are selling on rallies to the 20-day EMA of $0.85, but a positive sign is that the bulls have not ceded much ground. This suggests that the bulls are trying to hold on to their positions, as they anticipate a move higher.
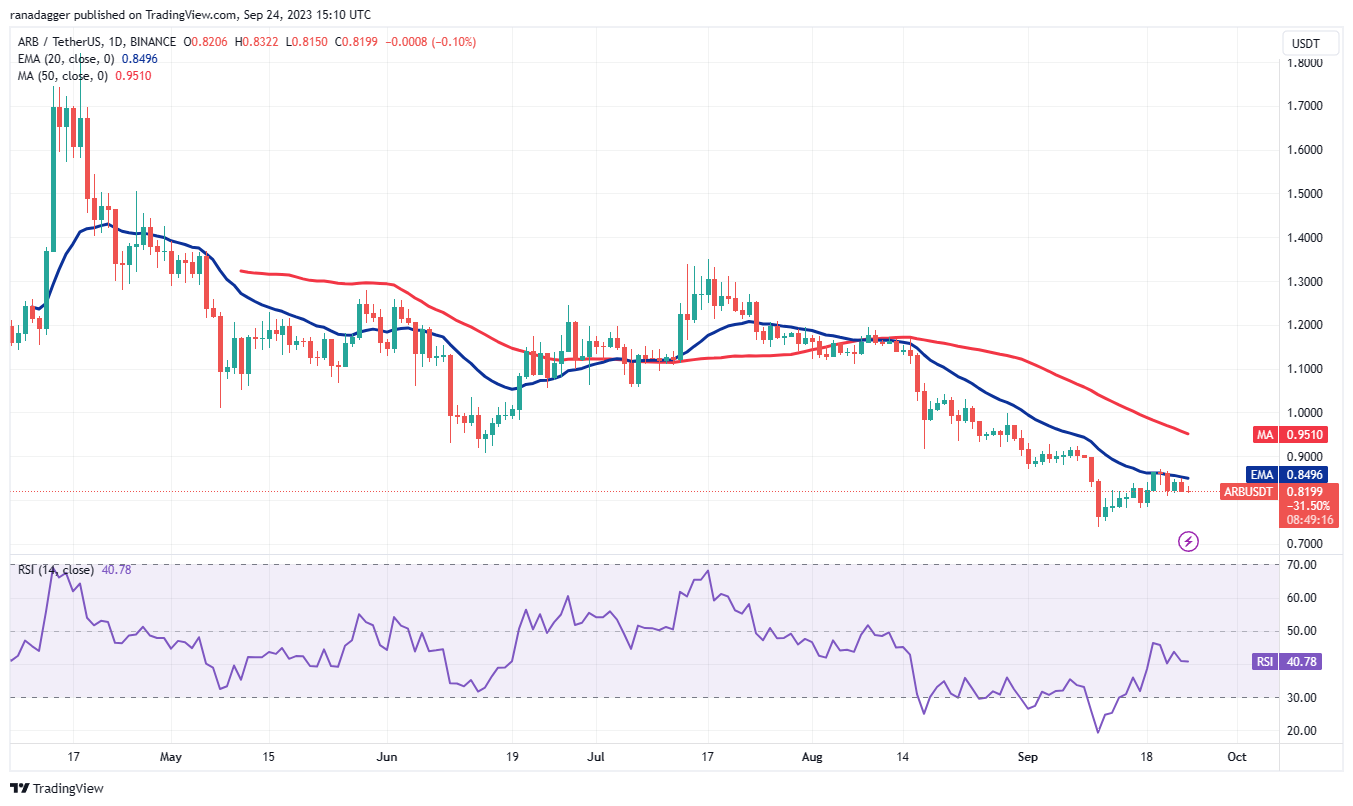
The RSI has risen above 40, indicating that the momentum is gradually turning positive. If buyers kick the price above the 20-day EMA, it will suggest the start of a sustained recovery. The ARB/USDT pair could first rally to the 50-day SMA of $0.95 and thereafter to $1.04.
The support on the downside is $0.80 and then $0.78. Sellers will have to drag ARB’s price below this zone to make room for a retest of the support near $0.74. A break below this level will indicate the resumption of the downtrend.

The 4-hour chart shows that the bears are selling the rallies to the downtrend line. The bears pulled the price below the moving averages but could not sink ARB below the immediate support at $0.81. This suggests that the bulls are trying to form a higher low.
Buyers will again try to propel the price above the downtrend line. If they succeed, Arbitrum’s price is likely to start a strong recovery toward the psychological level of $1. Contrarily, a break below $0.81 can tug ARB price to $0.78 and subsequently to $0.74.
Theta Network price analysis
Theta Network soared above the 20-day EMA of $0.61 on Sept. 23, indicating that the bulls have absorbed the supply and are attempting a comeback.

The bears have pulled the price back below the 50-day SMA of $0.64, but the bulls are expected to defend the 20-day EMA. If THETA price turns up from the current level and climbs above the 50-day SMA, it will enhance the prospects of a retest of $0.70.
This is an important level to keep an eye on because if it is scaled, the THETA/USDT pair may reach $0.76. This positive view will invalidate in the near term if the price turns down and plunges below the 20-day EMA. That opens the door for a potential retest of $0.57.

The 4-hour chart shows that the bears are protecting the overhead resistance at $0.65. If buyers want to sustain the bullish momentum, they will have to drive THETA above $0.65. If they do that, the pair is likely to start a new up-move toward $0.70.
The 20-day EMA is the important support to watch for on the downside. If bears sink the price below this support, it will indicate that the bulls are closing their positions. The pair may then descend toward the $0.58 support.


All Comments