



In this analysis, I will show you what insights I gained from the chronological representation of 973 crypto hacks and scams.
💾The Data Set
The friendly guys at Web3rekt shared some of their data with me. The dataset includes information on hundreds of crypto hacks that took place between 2011 and 2022.
Please note that in some cases I had to limit the following visualizations to the years 2018–2022 due to gaps in the data set.
🐦Crypto Hacks & Scams Overview
The following chart shows the total number of hacks and scams (blue line) and the total amount (orange bars) of funds lost in USD per month.
We see that months with high monetary losses occurred mainly in bull markets. The number of hacks and scams, on the other hand, has increased steadily over the past few years.
The next chart shows the total number of hacks and scams by blockchain.
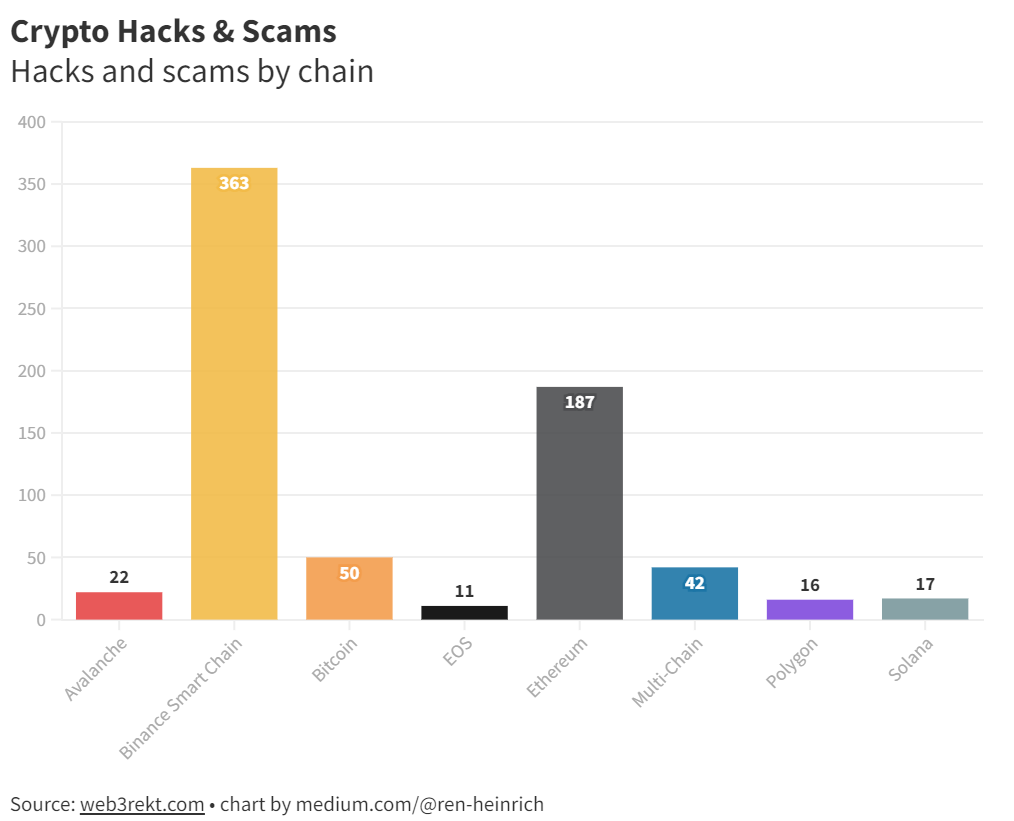
It is noticeable that most of the cases occurred on the Binance Smart Chain and Ethereum. The reasons for this are explained in more detail below.
The following chart shows the breakdown of various hacks and scam methods by blockchain. The methods most frequently used were taken into account.

Several things can be noted:
- 51% attacks: These happen on PoW chains. Because the costs of these attacks on the Bitocin blockchain are very high in comparison, other blockchains such as Ethereum Classic and Bitcoin Cash are mainly affected.
- Contract vulnerabilities: This is where Binance Smart Chain and Ethereum are most affected due to their smart contract capability and popularity.
- Key Management: All blockchains are affected. Bitcoin, Ethereum and Binance Smart Chain are the most commonly affected popular solutions.
- Scams: Again, the smart contract capability of Binance Smart Chain and Ethereum seems to contribute a lot.
🕑Analysis: funds stolen by crypto hacks & scams over time
- Up until 2019, contract vulnerabilities were the most common gateway for hacks and scams. They continue to be a big problem.
- Classic crypto scams such as rug pull, phishing attacks, and fake data took over in 2019 and by the end of 2022 represented by far the method with which the most money was stolen.
- Faulty key management is another major reason behind lost crypto funds.
The chart below shows which blockchains were most affected by crypto hacks and scams between 2011 and 2022. Since no information on the affected chain was available for a significant part, only those cases are shown for which the complete information was available.
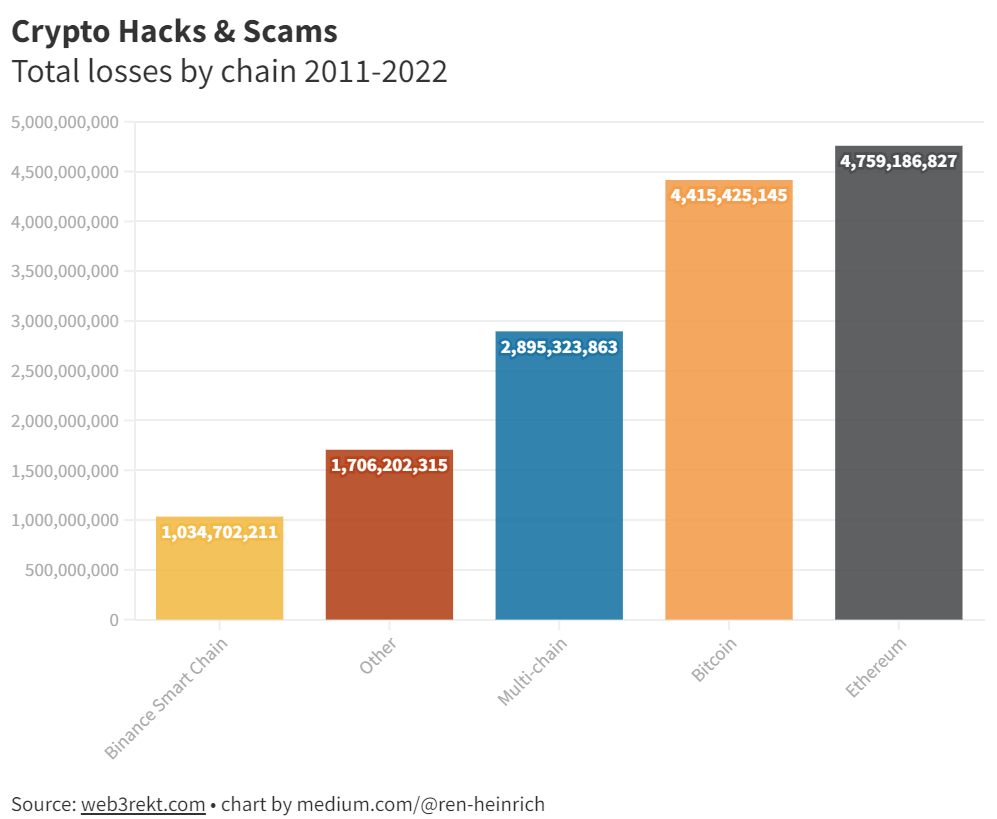
- It turns out that the highest losses from crypto hacks and scams occur on the Ethereum and Bitcoin blockchains. This is logical insofar as these are two old chains.
Crypto Hacks & Scams Losses by chain by year 2011-2022
- In the period from 2011 to 2015, only Bitcoin was affected. This was because the other blockchains were used very little in comparison.
- That changed abruptly with the advent of Ethereum in 2016.
- From 2018 onwards and with strong growth happening in the crypto space we see that other blockchains are also getting affected.
- In 2022, Binance Smart Chain suffered the most from hacks and scams, this is due to the rapidly increasing number of users of this blockchain.
🧮The takeaways
I draw the following conclusions from this analysis:
- The three main methods of hacking — scams, contract vulnerabilities, and key management — are consistently at the top over the observed period.
- All three have both technical and human aspects that cannot be easily solved due to the digital and decentralized nature of blockchain technology.
- They will likely continue to be important gateways for hacks.
- Accordingly, as a user, you should always exercise special caution, especially when you work with new or unknown services and solutions.
- No crypto project is safe from hacks and scams. It is understandable that the field of affected chains has changed over the years since the crypto sphere as a whole has grown.
- What is very interesting, however, is that the proportion of scams related to the Bitcoin blockchain in 2022 in relation to the total lost funds has fallen sharply. Could the reason be that long-term Bitcoin holders interact much less with their coins?
- In contrast, the proportion of the Ethereum blockchain and most recently the Binance Smart Chain has increased significantly in recent years. This is directly connected to the contract vulnerabilities, which, according to the data set, actually do not affect Bitcoin users. However, this could change in the future if Bitcoin gains smart contract functionalities.


All Comments