

In the world of trading, liquidity issues are crucial for any type of investor, trader, or exchange. This report aims to introduce and analyze liquidity changes from the perspective of order book depth in centralized crypto exchanges for investors. LTP, as a top-tier prime broker in the crypto industry, uses a proprietary liquidity scoring method to comprehensively evaluate the liquidity performance of exchanges.
Download the full report: https://bit.ly/3VNTb6F
By comparing order book depth data for over 13 cryptocurrency pairs across 12 mainstream exchanges, we introduce LTP Liquidity Score for exchanges and coins/tokens. Meanwhile, by aggregating and normalizing historical liquidity scores of exchanges, we introduce the LTP Liquidity Index to illustrate the trend of the whole market liquidity change.
The liquidity score and liquidity index straightforwardly show how major exchanges' liquidity is volatile with the BTC price fluctuation. By comparing these indicators, this report draws the following key points:
The top four exchanges with the best liquidity are Binance, Kraken, Coinbase, and OKX, with their rankings remaining relatively stable over time.
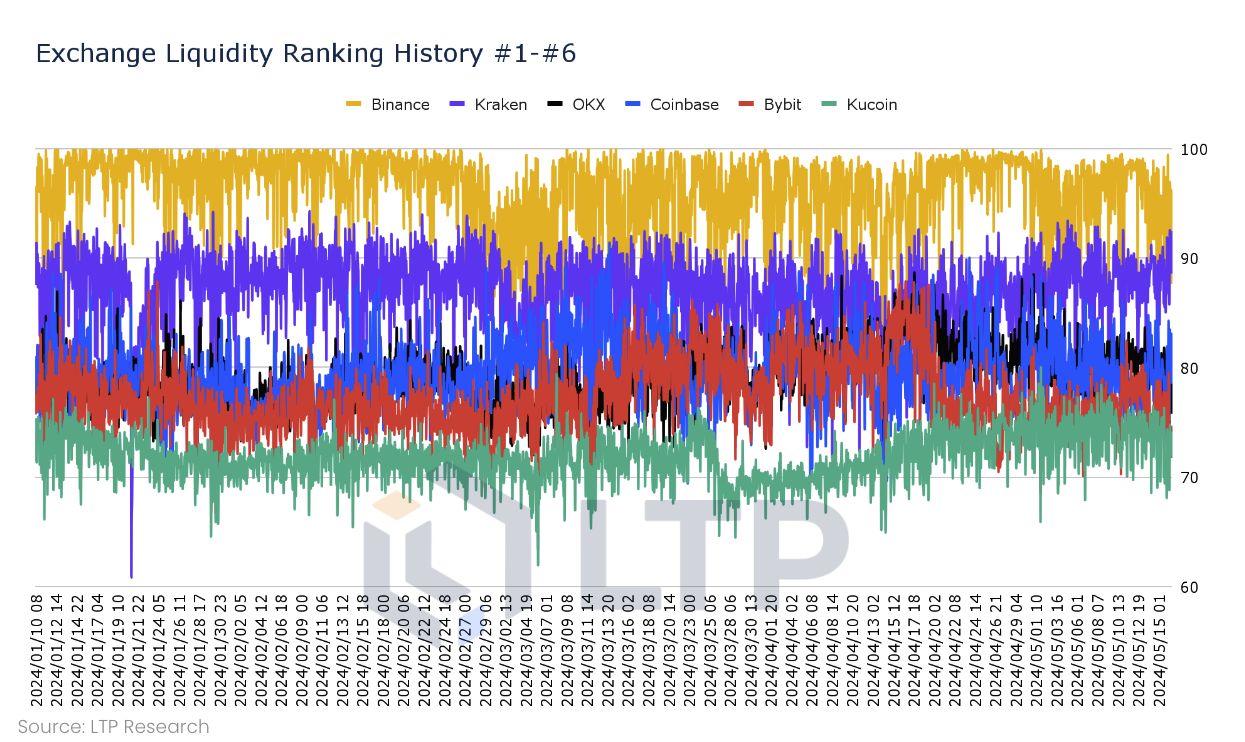
Since March 2024, Gate and KuCoin have shown a gradual improvement in liquidity performance, while Bitfinex's liquidity has exhibited higher volatility.
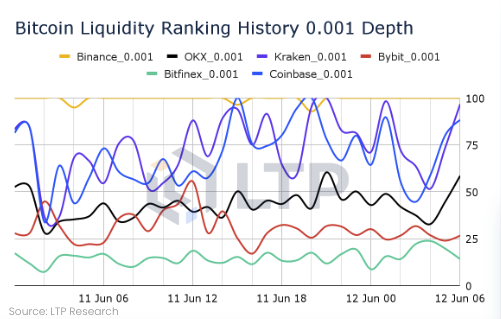
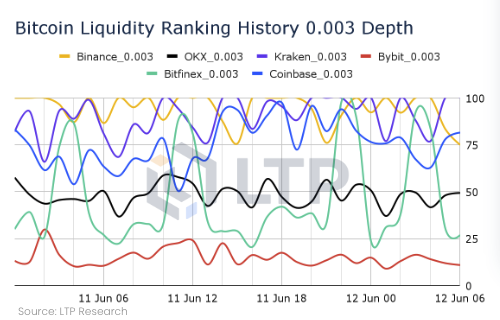
Bitcoin liquidity performance: Only within the 0.1% price range does Binance consistently maintain a leading position in liquidity performance. Once the price range exceeds 0.3%, Binance's Bitcoin trading pair liquidity becomes more volatile, and Kraken's liquidity performance becomes relatively higher.
Ethereum liquidity performance: The liquidity of Ethereum on all exchanges is more volatile across five price range levels compared to Bitcoin. Conversely, Binance's Ethereum liquidity score becomes more stable only when the price range exceeds 0.3%.
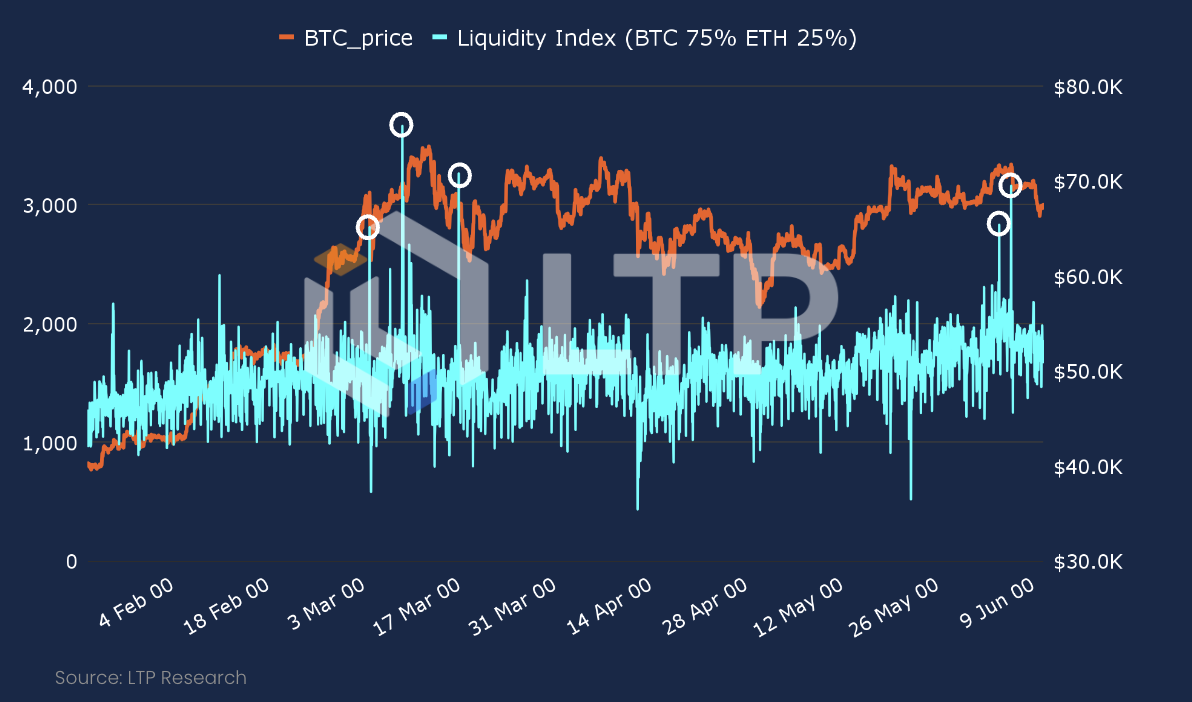
Observing the LTP Liquidity Index, from January to June 2024, the LLI has steadily increased, with five liquidity peaks. The first three occurred in March when Bitcoin's price broke previous highs, and the last two occurred in early June.
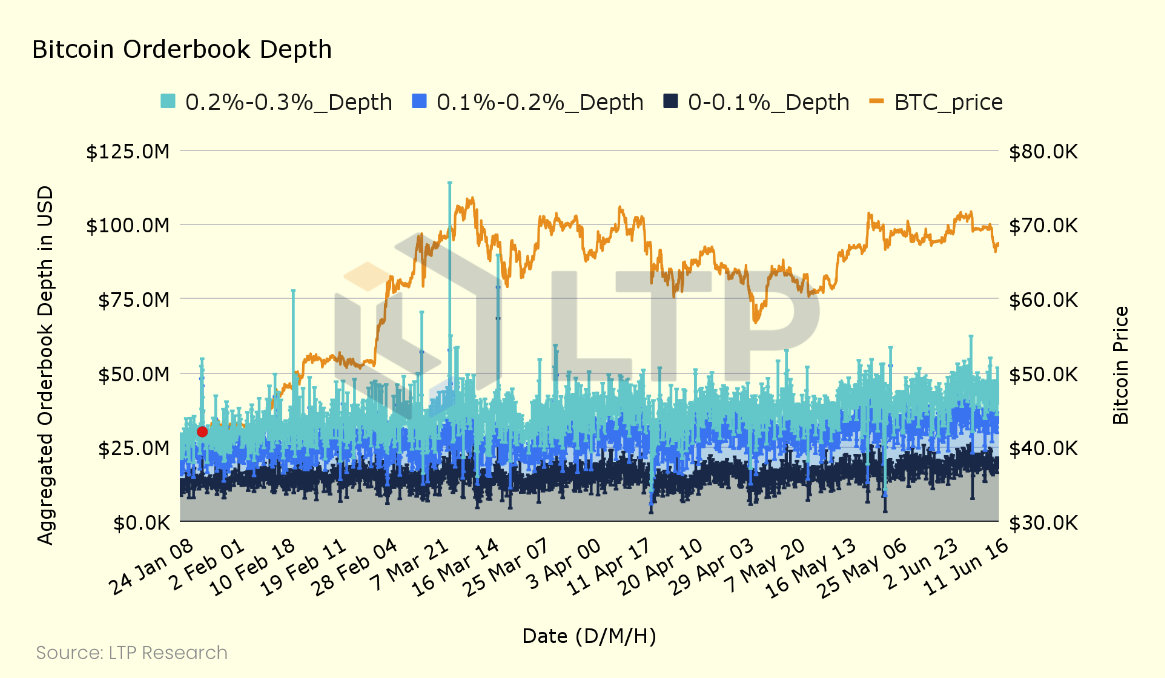
The chart below displays the layered depth data of BTC order books across three exchanges. Although the actual calculations divide the BTC order book depth data into five layers (0-0.1%, 0.1%-0.2%, 0.2%-0.3%, 0.3%-0.4%, 0.4%-0.5%), for clarity, this chart only shows the first three layers. It is easy to observe that the liquidity peaks in March occurred primarily in the 0.2%-0.3% range.
Download the full report: https://bit.ly/3VNTb6F
Disclaimer:
The contents of this report are provided as general information only and should not be used as a recommendation or basis for making any specific investment, business or commercial decision. Any contents herein should not be construed as a recommendation, an offer or solicitation for the subscription, purchase or sale of the cryptocurrency or any related investment products. All information or market data provided by us is for reference only. Please do not regard the information or data provided as express or implied commitment of income from investment, nor deem as investment advice or feasibility analysis, prediction or suggestion on market trend, nor take as advice or recommendation of any investment. We assume no responsibility for or make any representations, endorsements, or warranties whatsoever in relation to the timeliness, accuracy and completeness of any services, content, information and/or data contained in this report. The information contained herein is not intended to provide professional advice and should not be relied upon in that regard. It also does not have any regard to specific investment objective, financial situation and is not tailored for individual needs. Accordingly, no warranty whatsoever is given and no liability whatsoever is accepted for any loss arising whether directly or indirectly as an outcome of acting base upon this information.


All Comments