

In this article, we look at what the on-chain metrics has looked like for Bitcoin spending.
In this first chart below, we look a BTC spending for the following supply distribution group. Each group are separated by tabs.
Holders holding 10–100 BTC
Holders holding 100–1,000 BTC
Holders holding 1,000–10,000 BTC
Holders holding 10,000 + BTC
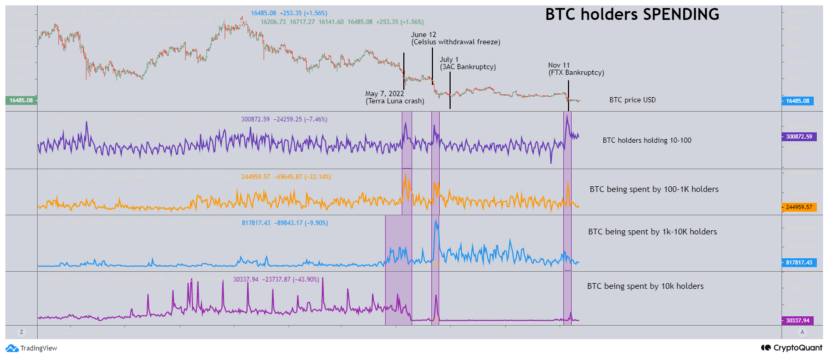
In the light purple box, I highlighted the spending for the following events:
May 7th, Terra LUNA and UST crash
June 12th, Celsius withdrawal freeze
July 1st, Three Arrow Capital Bankruptcy Filing and withdrawal Freeze
November 11th, FTX Bankruptcy filing
Here we can see that spending by all groups spiked during these events. When we see spikes like this, it means that large amounts of BTC have been moved aka spent. When this happened, we can also see that the BTC price also reacted and moved downward in responding to the spike in BTC spending.
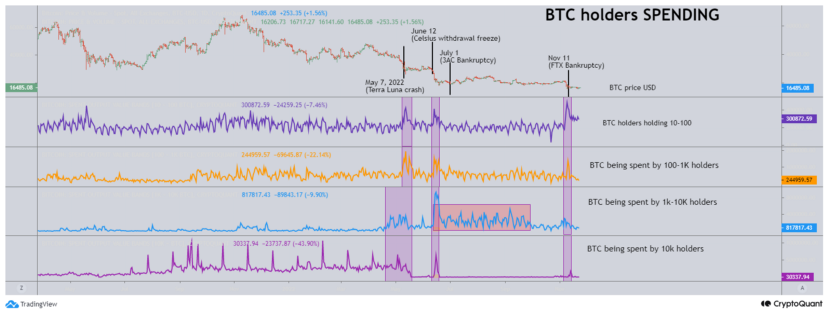
This next chart below, I want to highlight in light red that holders holding 1,000–10,000 BTC was spending their BTC throughout this $20k BTC price this past few months.
Let’s look at the exchange inflows in this next chart below. We can see on here that exchange inflows have spiked multiple times since May 2022. This was also when many of the Bitcoin was being spent by holders holding 1k-10k BTC.
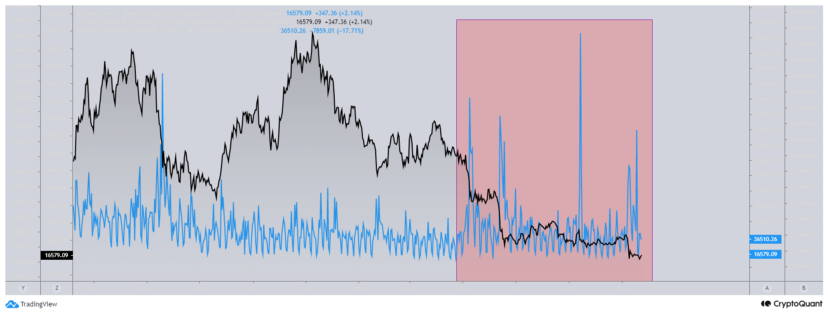
Exchange inflows can be looked at as possible incoming sell pressure. However it is important to keep in mind that sometimes Bitcoin are moved onto an exchange as a place holder rather than to be sold and then moved back off exchanges.
Now, let’s go back further and take a quick look at the May crash of 2021. This is the first purple box on the left of the cart below.

Right when the price started moving downward, we can see spending spiked in the holders holding 10–100 BTC. Because the price moved down, we can assume that the spent Bitcoin was most likely sent onto exchanges to be sold. However, the selling pressure during May 2021 was not due to larger holders holding 100 BTC or more. Instead, it was smaller holders spending their BTC.
But then, let’s look at what happened during the second bull run of the second half of 2021.
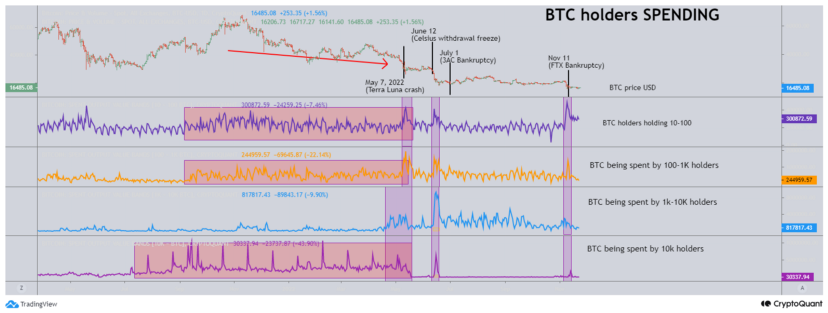
We can see that as price moved up, we can see that the spending by holders holding 10–100 BTC, holders holding 100–1,000 BTC and holders holding 10,000 + BTC were being spent. As this continue, eventually, the price of Bitcoin started to move downward. Everything is hindsight now, but the heavy spending was the indicator that the top was in and a reversal was coming.
Why is the metric Bitcoin Spending important?
Here’s why looking at Bitcoin spending is important. Normally when large amounts of Bitcoin are spent, then there’s normally some price action that reflects it. In the case of this past year, Bitcoin’s price has moved down as a response to Bitcoin spending spiking up. When BTC spending slowed down as it did after the May 2021 crash then that allowed Bitcoin’s price to move up. This is because less spending causes less sell pressure leading to less available supply on the market. If demand goes up, then it means more holders will accumulate. Because less available supply is in the market due to less spending then price moves up due to demand from buyers, this therefore increases the value of Bitcoin.
In short, in most situations, if spending goes down then the value of Bitcoin goes up. If spending goes up then more often, the value of Bitcoin goes down in response. Due to this, BTC spending is one of the many important metric to look at.
This article is not financial advice and is me sharing what my analysis of BTC based on its spending metric. Going forward, what I’ll be looking for is for the BTC spending metric to slow down for a good period of time. This lets me know that everyone who are looking to spend their BTC has already done so.


All Comments