

Cointime

Download App
iOS & Android

How low can the Bitcoin price go?

Cointime Official

From cointelegraph by Nancy Lubale

Bitcoin price has declined by more than 6% over the last 24 hours after rallying to anall-time high of over $109,000a week ago.

Data from Cointelegraph Markets Pro andCoinbase shows that the BTC price fell from a high of $105,424 on Jan. 26, dropping as much as 7.3% to reach an intraday low of $97,750 on Jan. 27.
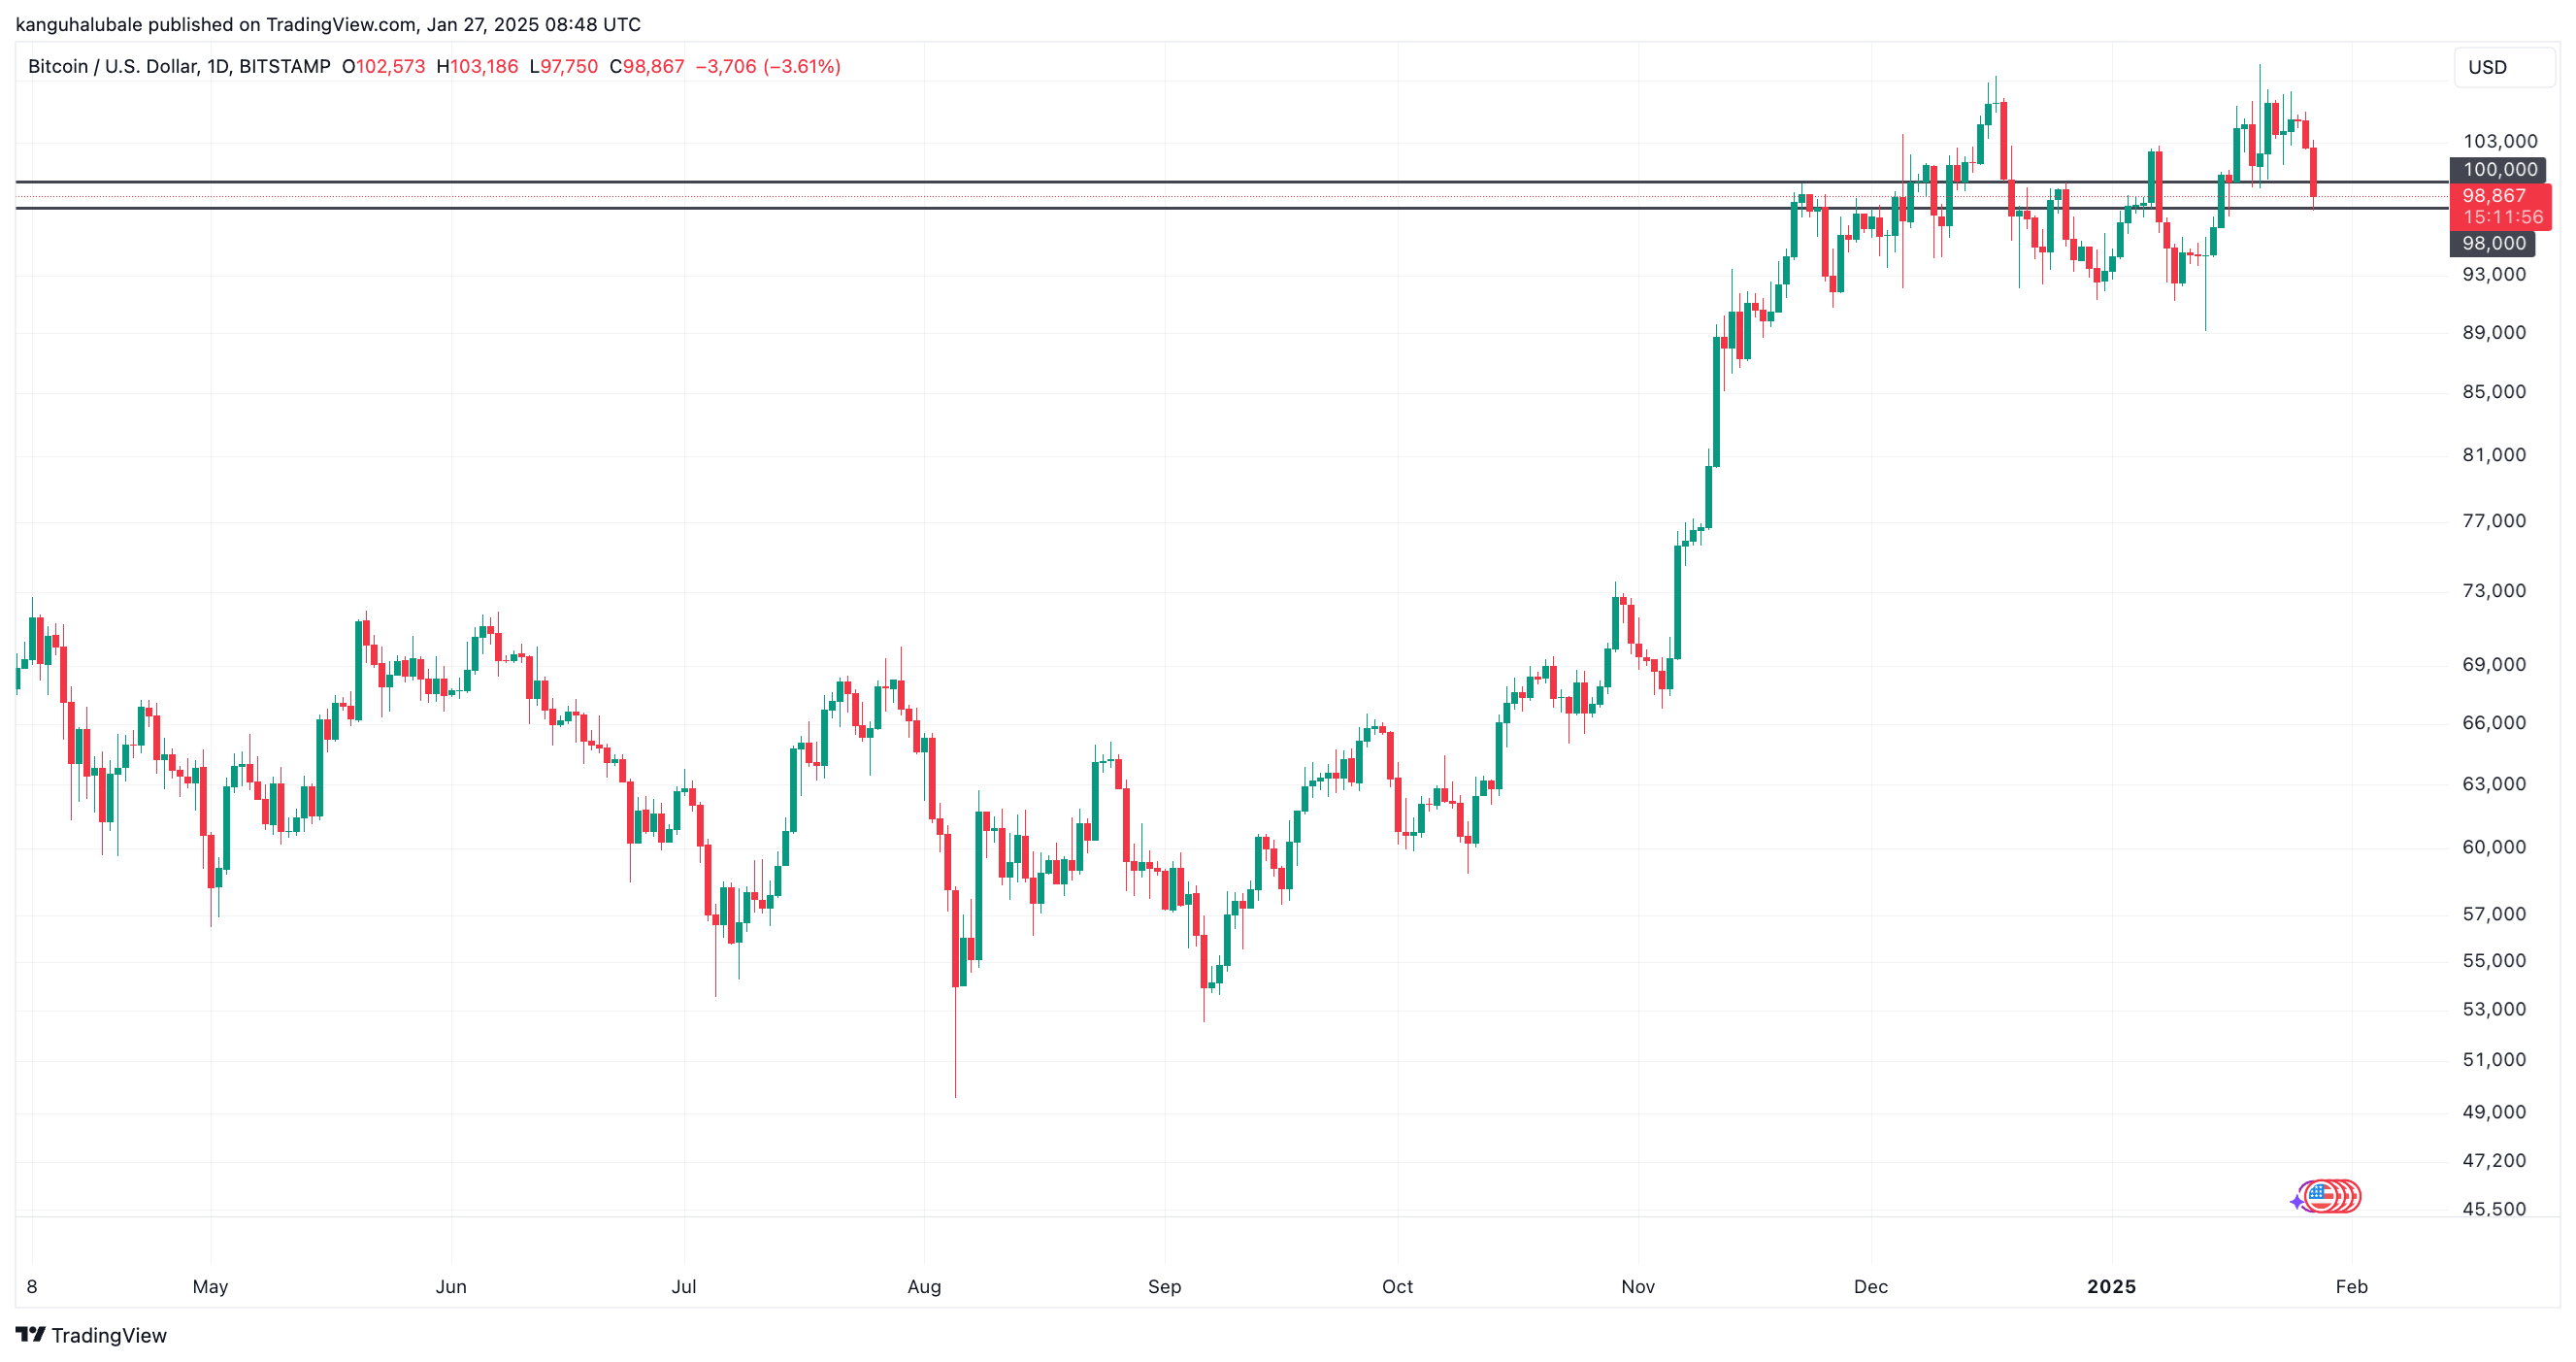
  BTC/USD daily chart. Source: TradingView

Bitcoin’s price drop coincides with a drawdown in the broader crypto market triggered by the release of DeepSeek R1, which has shaken the AI sector and negatively affected the prices of AI-themed tokens.

This has left market participants wondering how low BTC prices can go over the next few days.

Could Bitcoin price drop to $70,000?

After a failed attempt to hold above $100,000 on Jan. 27, the BTC has retraced toward the $98,000 demand zone. 

“Bitcoin price approaches the $100,000 level and is looking weak!” said Bitcoin analyst AlphaBTC in a Jan. 27 post on X.

“$BTC and TradFi futures have been selling off all night, looking really weak as we start a fresh week.”

The accompanying chart below reveals that if bulls reclaim $100,000, the price could rebound from the current levels. 

On the contrary, AlphaBTC said that the support at $100,000 was weakening, and the breakdown of this level could cause Bitcoin's price to go below $90,000. 

“The 100K level looks like it’s going to get run this time, but the question will be if #BTC can reclaim it with a strong reaction, or will we revisit sub 90K once again?”
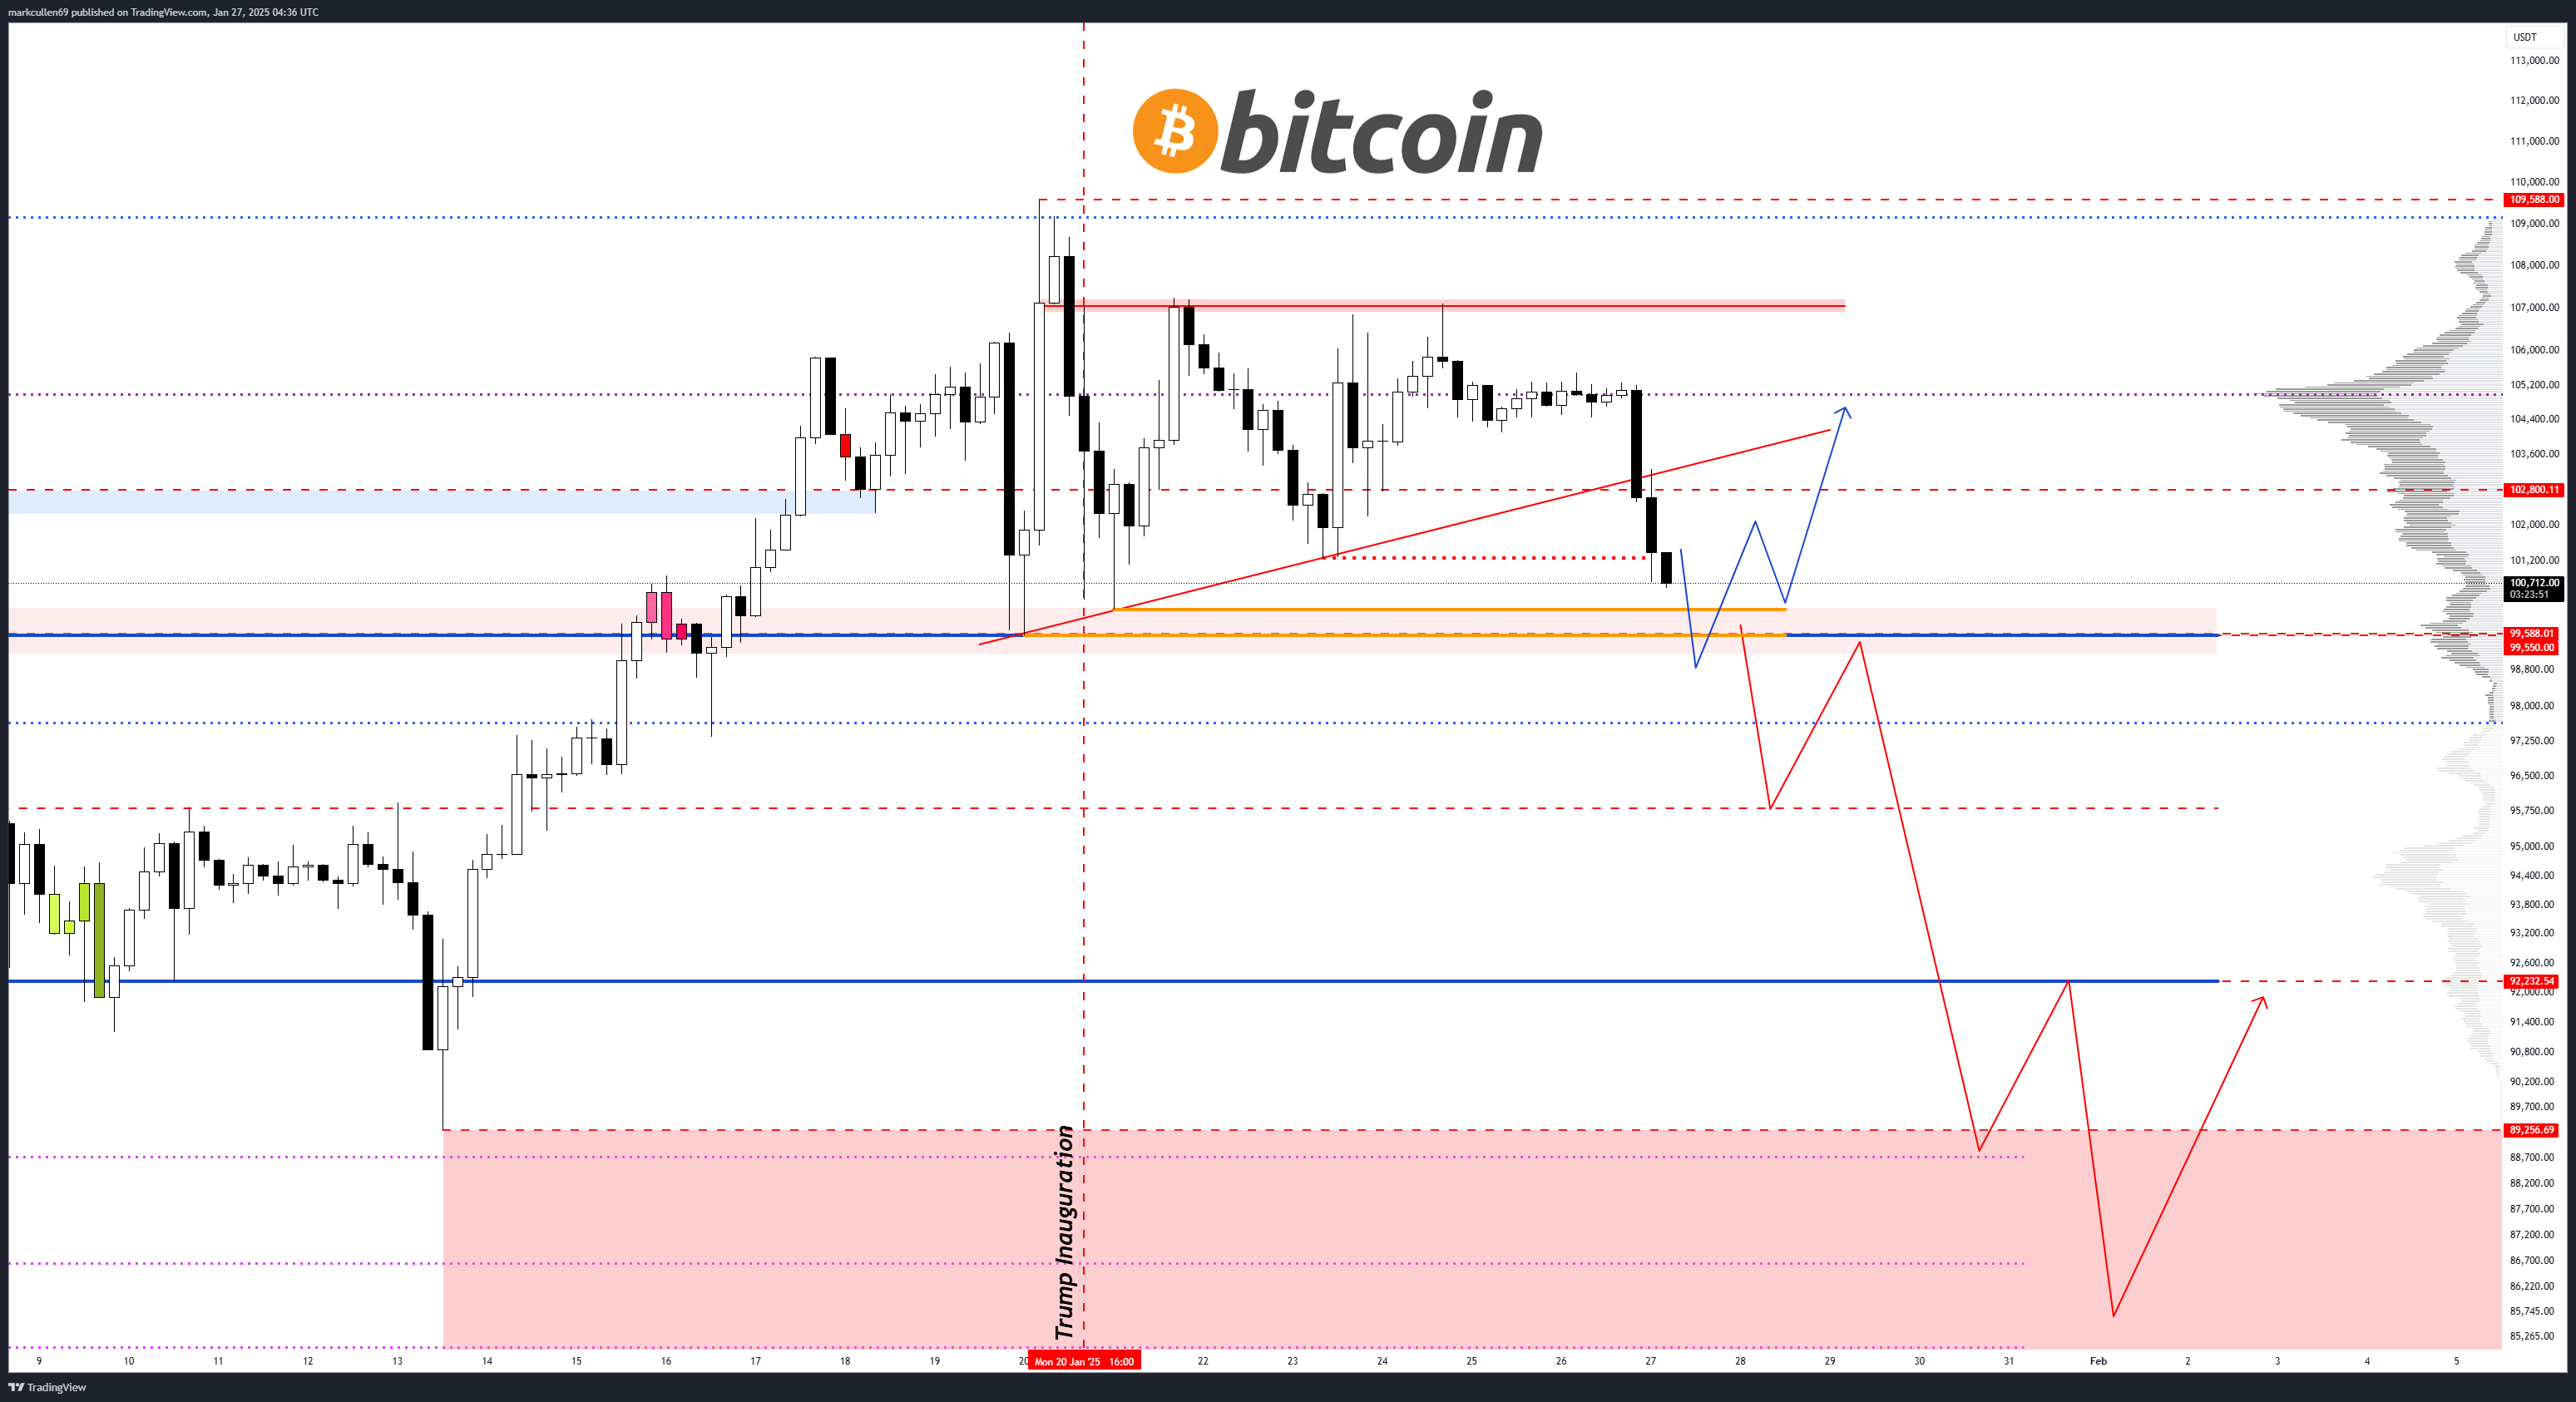
  BTC/USD daily chart. Source: TradingView

BitMEX co-founder Arthur Hayes predicts that Bitcoin could potentially pull back toward the $70,000 to $75,000 range, a move that may trigger a “mini financial crisis.”

According to Hayes, this could lead to a “resumption of money printing” that will send BTC price to $250,000 by the end of the year.

Founder of MN Capital Michael van de Poppe asked his 767,000 X followers not to panic, arguing that the ongoing sell-off is nothing more than just a “short-term shock and panic reaction on the markets.”

According to van de Poppe, the area between $99,000 and $98,000 is an “exciting entry zone” for  Bitcoin investors. 

He warned that if demand-side pressure doesn’t mount up from the said level, the price could dip into the lower end of the $89,500 to $91,500 range.
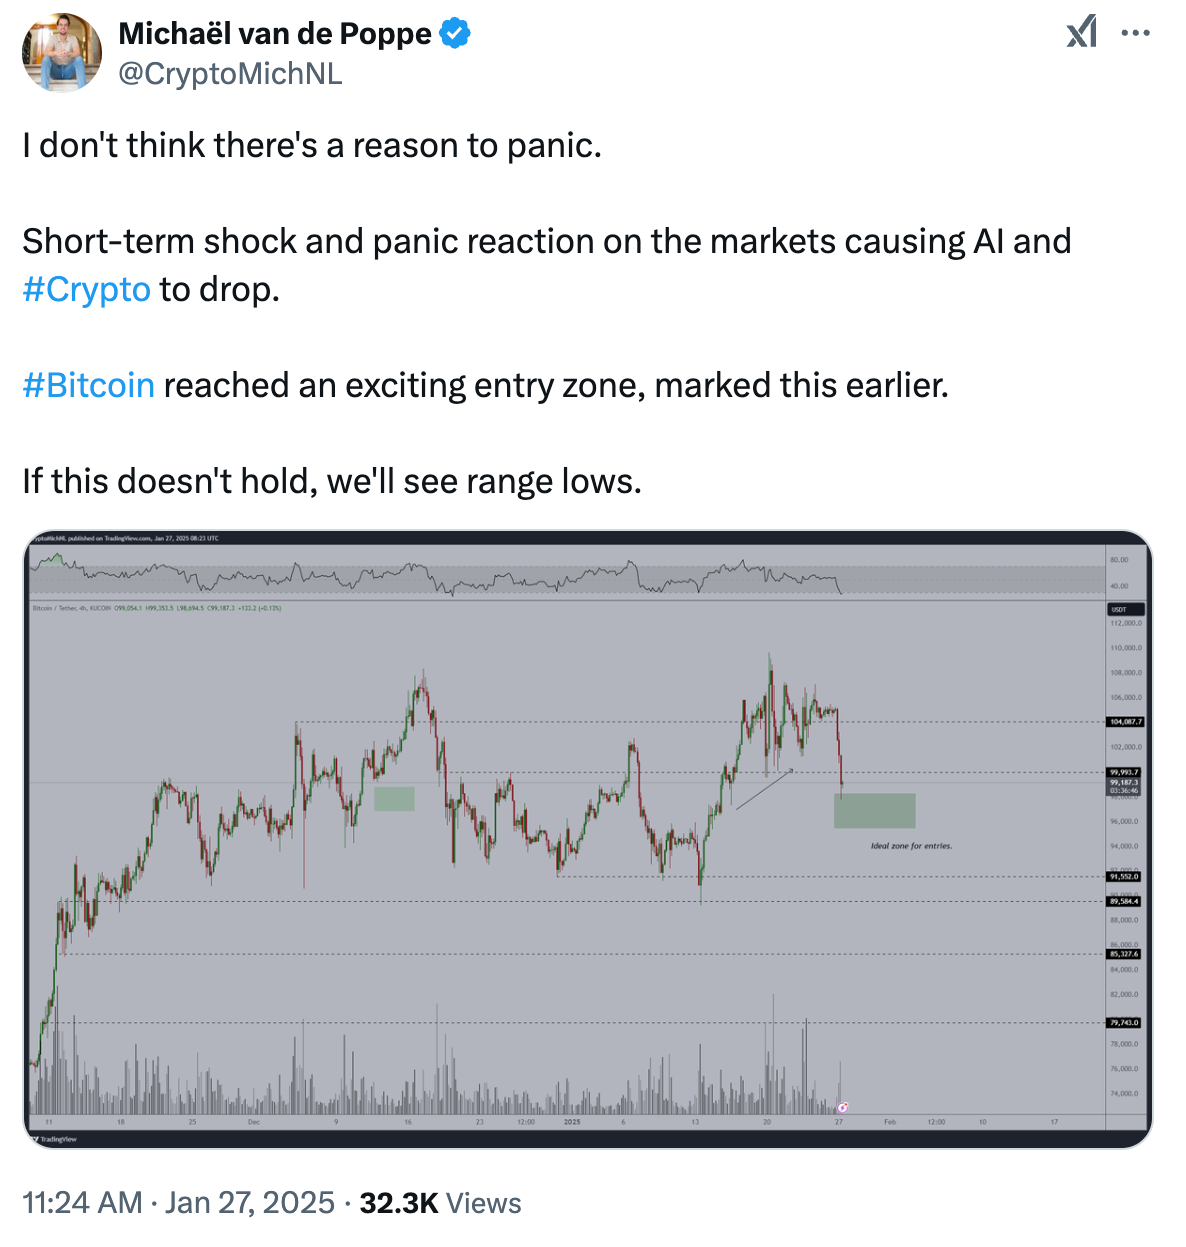
  Source: X/Michael van de Poppe

Related: Bitcoin falls below $100K for the first time under Trump presidency

50-day EMA is a test for Bitcoin

From a technical point of view, Bitcoin’s price is trading above the $97,900 support level, embraced by the 50-day exponential moving average (EMA).

Losing this support could cause the BTC price to collect demand-side liquidity down toward the 100-day EMA, currently at $91,482.
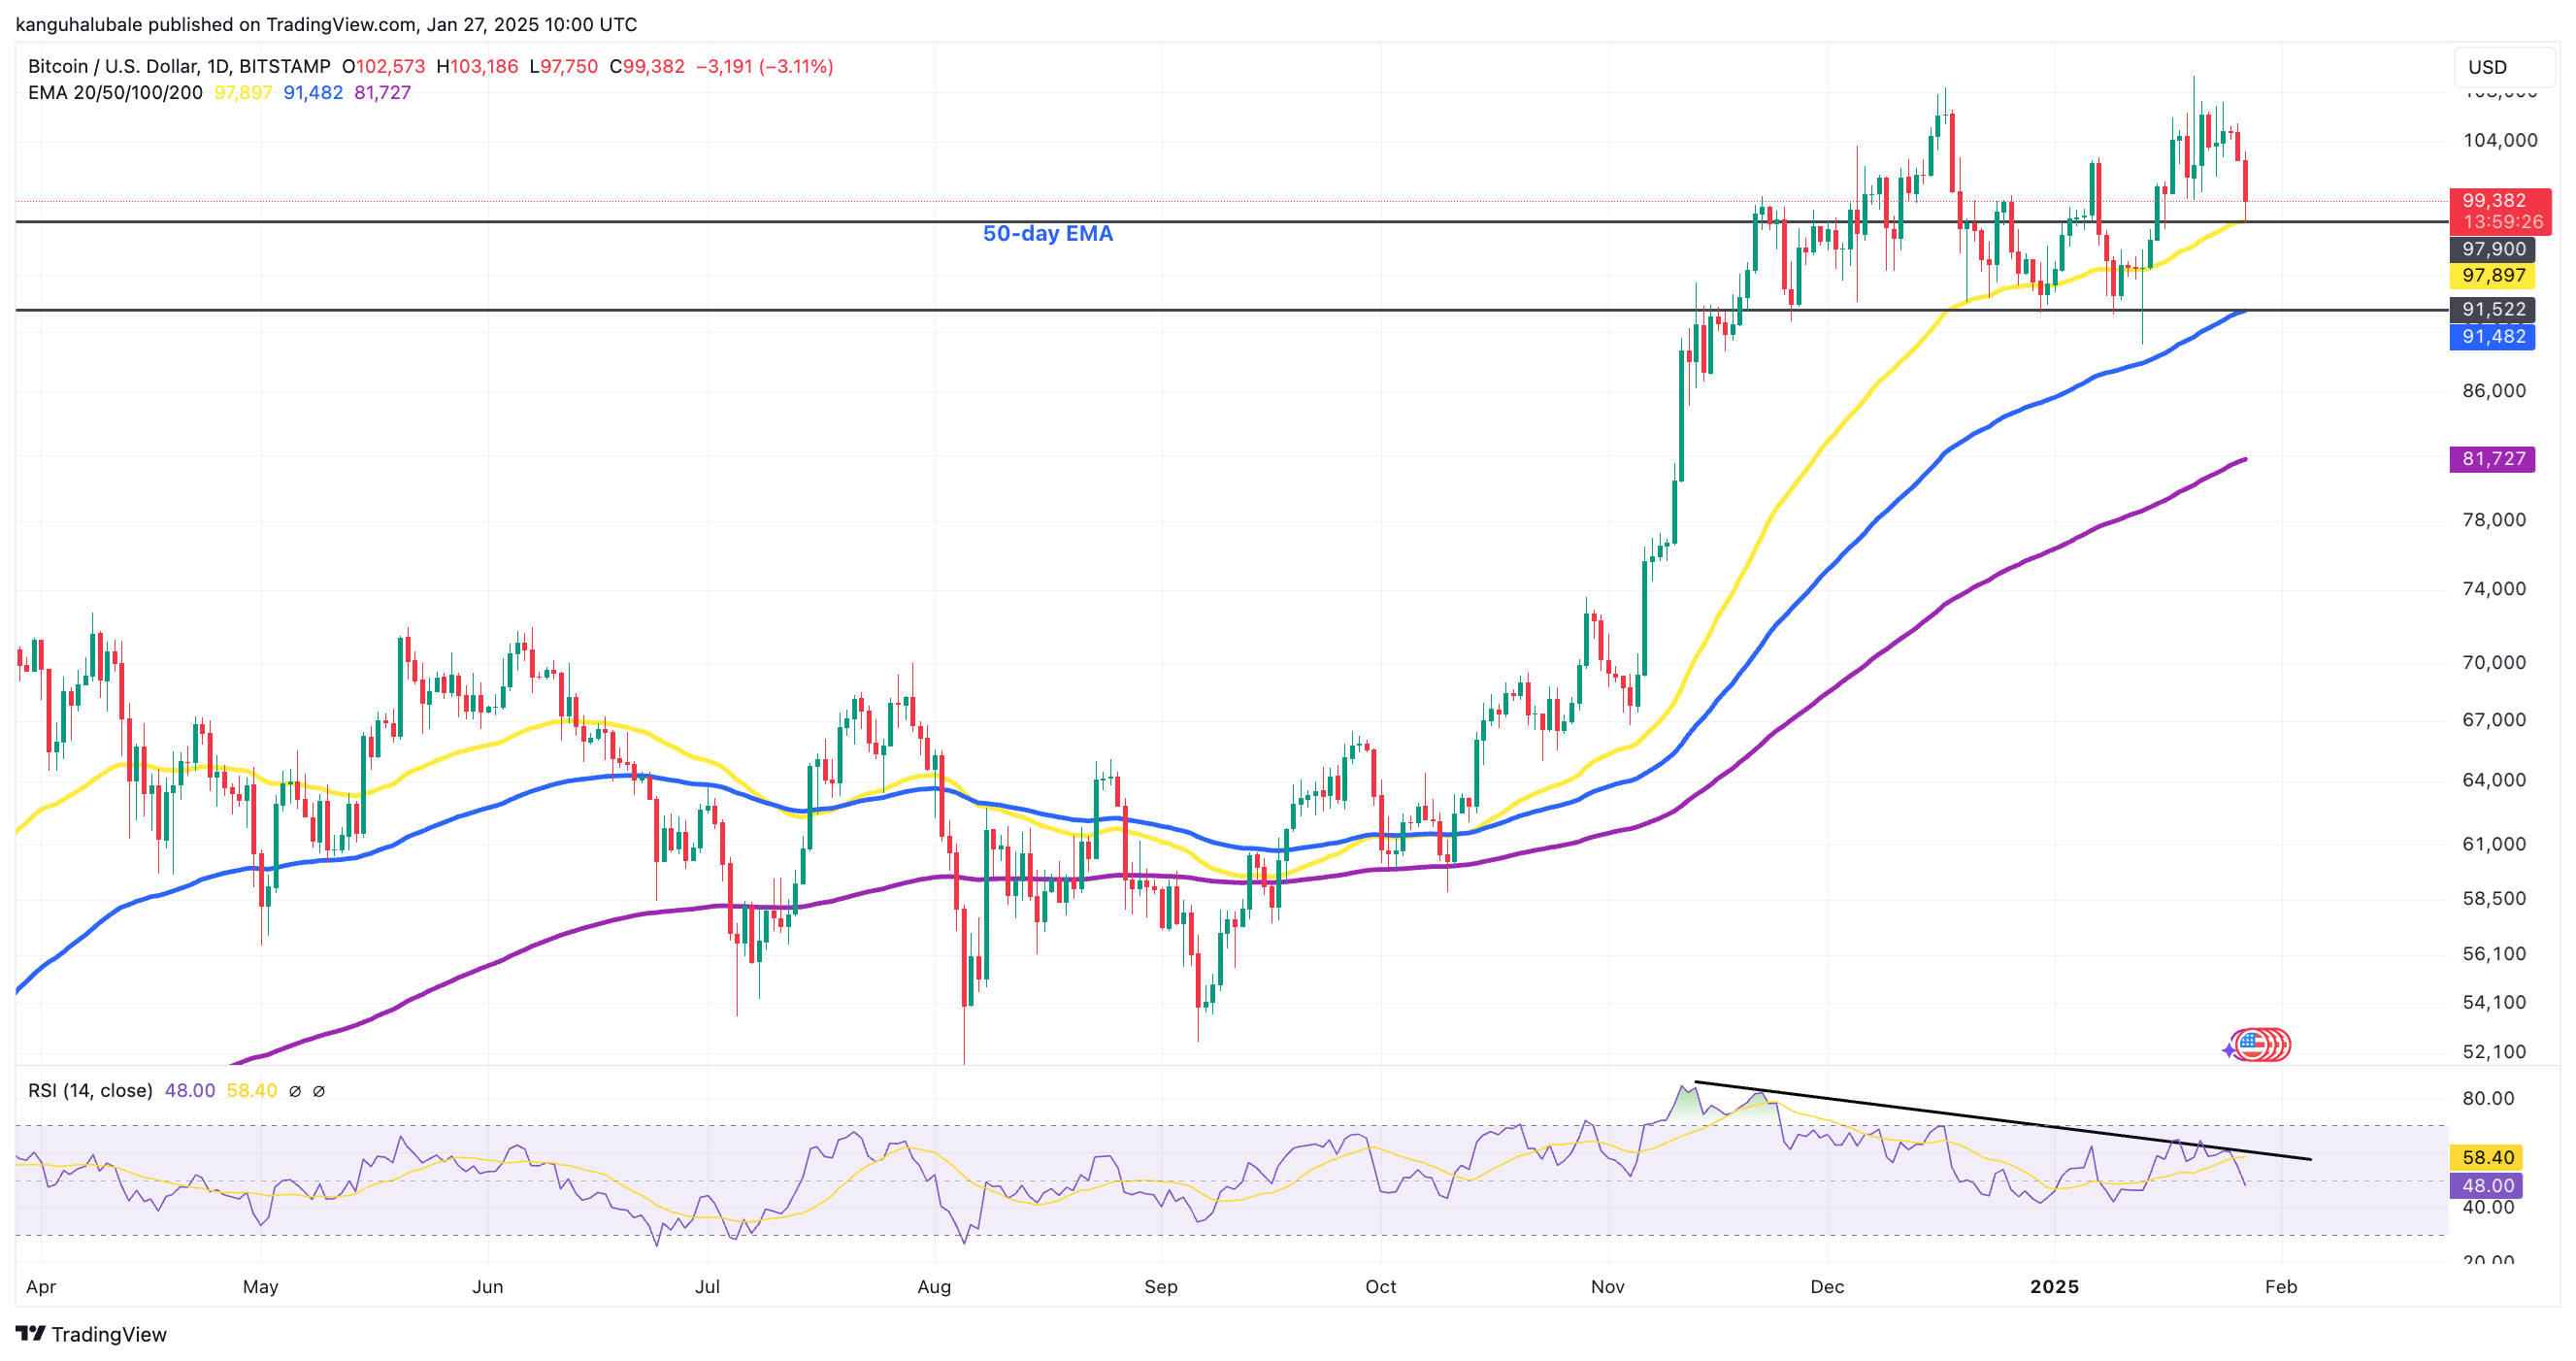
  BTC/USD daily chart. Source: TradingView

The importance of the 50-day EMA was reinforced by significant liquidity building up just above the $98,000 support level, as shown by data from CoinGlass. 
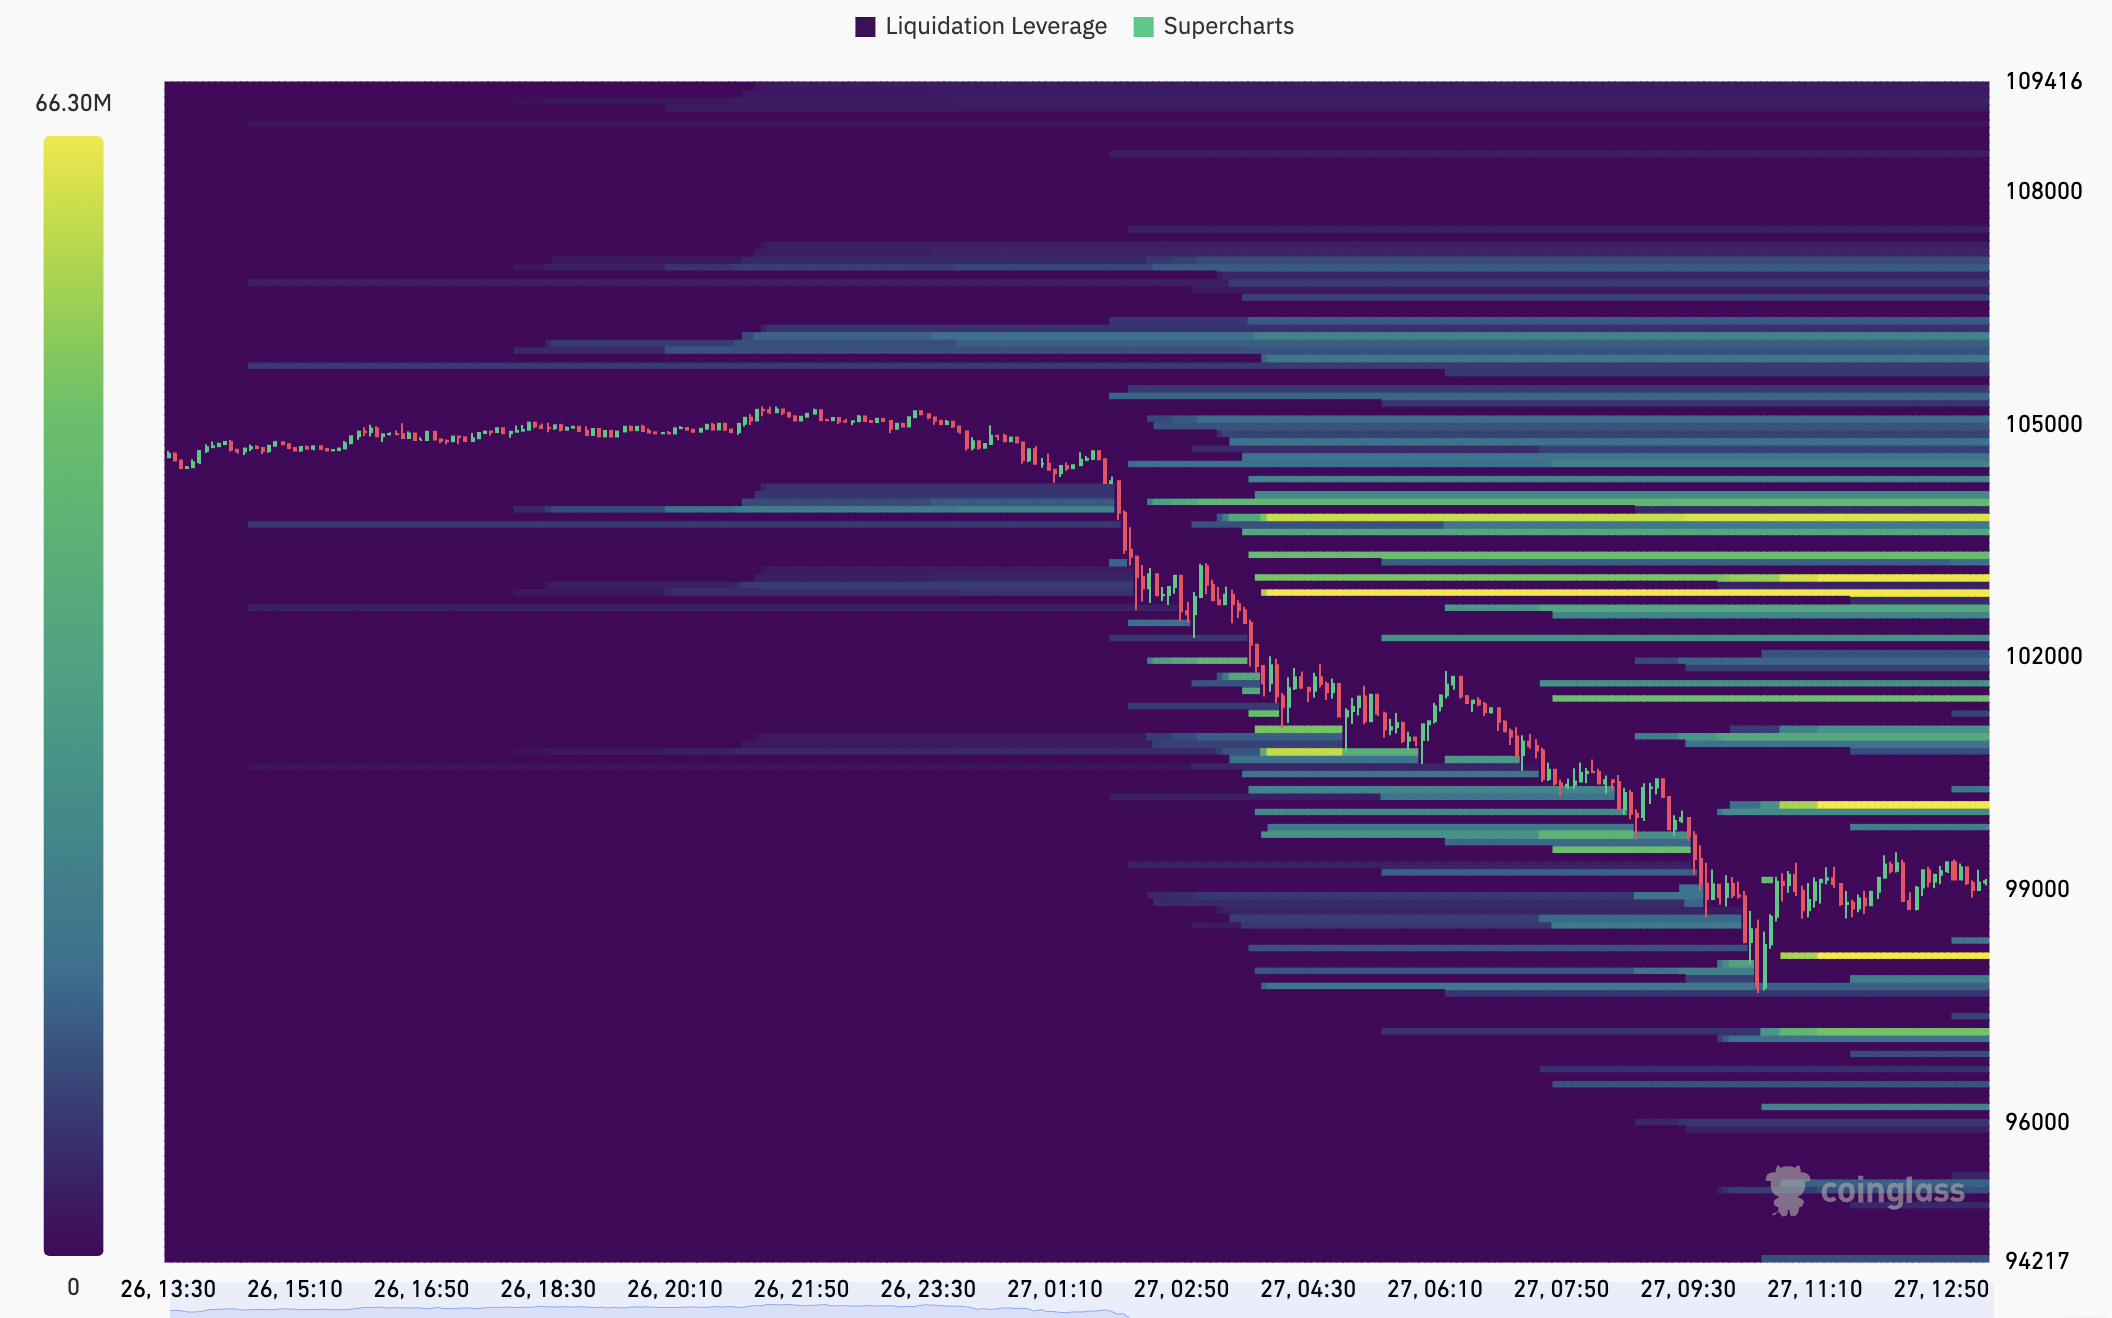
  Bitcoin liquidation heatmap. Source: CoinGlass

In other words, the 50-day EMA at $96,900 has a good chance of becoming the new local low for Bitcoin before the next leg up. On the other hand, breaking below $ 90,000 could present real trouble for the bulls in Q1.

Comments

All Comments

Recommended for you

  • Trump Shares Op-Ed Claiming He is Winning the War Against Iran

    On August 29, U.S. President Trump shared a commentary article from the New York Post on Truth Social on Saturday, which stated that he is winning the war against Iran and should maintain the current strategy. The title of the article Trump shared read: 'Trump is Winning the War Against Iran - Stay the Course.'

  • Morgan Stanley: 2028 as a Key Observation Point for Global Memory Competition Landscape

    On August 29, Morgan Stanley pointed out that the rise of Chinese memory manufacturers should not be viewed merely as a technological catch-up or low-cost substitution; what is truly noteworthy is that their production capacity may gradually become large enough to alter the supply structure of the global memory market. Changxin Technology and Yangtze Memory Technologies are currently entering the mainstream product market and gradually extending into high-profit markets such as HBM, high-end server DRAM, and enterprise SSDs. Morgan Stanley considers 2028 as an important observation point for the global memory competition landscape. From 2026 to 2027, demand for AI servers, capacity crowding of advanced wafers by HBM, import substitution, and the time required for customer certification may absorb most of the new supply from Chinese memory manufacturers. By 2028, as Chinese manufacturers expand production, the additional capacity from Samsung, SK Hynix, and Micron, which had previously initiated expansions, will also be released. At that time, the supply variables in the global memory market will significantly increase. Morgan Stanley estimates that Changxin's DRAM monthly production capacity will rise from 180,000 wafers in 2025 to 300,000 in 2026, accounting for approximately 13% of global DRAM wafer capacity and about 11% of bit shipments; by 2028, it is expected to further increase to 500,000 wafers, and by 2031, it could reach 800,000 wafers. If the expansion proceeds smoothly, Changxin's global DRAM bit shipment market share could approach 15% by 2030, and it may even have the opportunity to surpass Micron in production capacity around 2028, becoming the third-largest DRAM supplier in the world.

  • US Spot Ethereum ETF Sees Net Inflow of $102.17 Million Yesterday

    On August 29, according to monitoring by Trader T, the US spot Ethereum ETF recorded a net inflow of $102.17 million yesterday.

  • US Spot Ethereum ETF Sees Net Inflow of $102.17 Million

    On August 29, according to monitoring by Trader T, the US spot Ethereum ETF experienced a net inflow of $102.17 million yesterday.

  • US Spot Bitcoin ETF Sees Net Outflow of $201.81 Million

    On August 29, according to monitoring by Trader T, the US spot Bitcoin ETF experienced a net outflow of $201.81 million yesterday.

  • US Spot Bitcoin ETF Sees Net Outflow of $201.81 Million Yesterday

    On August 29, according to monitoring by Trader T, the US spot Bitcoin ETF experienced a net outflow of $201.81 million yesterday.

  • BTC Surpasses $78,000

    Market data shows that BTC has surpassed $78,000, currently priced at $78,009.49. The 24-hour decline has narrowed to 3.23%. Due to significant market fluctuations, please ensure proper risk management.

  • BTC Surpasses $78,000

    Market data shows that BTC has surpassed $78,000, currently priced at $78,009.49, with a 24-hour decline narrowing to 3.23%. The market is experiencing significant volatility, so please ensure proper risk management.

  • BTC Briefly Drops Below $77,000

    Market data shows that BTC briefly fell below $77,000, currently reported at $77,694, with a 24-hour decline of 3.3%. The market is experiencing significant volatility, so please ensure proper risk management.
