
Every market cycle comes with memecoins. If you’re not familiar with the concept, think about the craze of r/wallstreetbets driving the rally of AMC in 2021. A bunch of people rally around some meme and bid the price of some asset up for a short while (anywhere from one day to a couple months). It’s become a popular go to market strategy in crypto for everything from the blockchain layer to the app layer - as you drive up not just prices but attention around an ecosystem. Some like Avalanche go as far as creating an actual official fund for memecoins.
The line between memecoin and any other token can sometimes be blurred, but the general assumption here is that there is nothing backing the token besides the meme. For example, DOGE as a token only really has the shiba inu doge picture/idea backing it. Unlike a token like ETH that’s secured by the ethereum blockchain, UNI which has the full Uniswap protocol behind it, or a token like MKR that has a full collateralized stablecoin service behind it.
Farcaster memecoins (like DEGEN) are the newest flavor, with the primary benefit being that the social is openly accessible. So with that, I wanted to test the waters with some basic analysis combining social and financial data.
I ended up with this 📊 dashboard, which I will walk through in this article.
Measuring the Meme
I started with the hypothesis that we could compare all memecoins with a simple chart that graphs social and financial health:
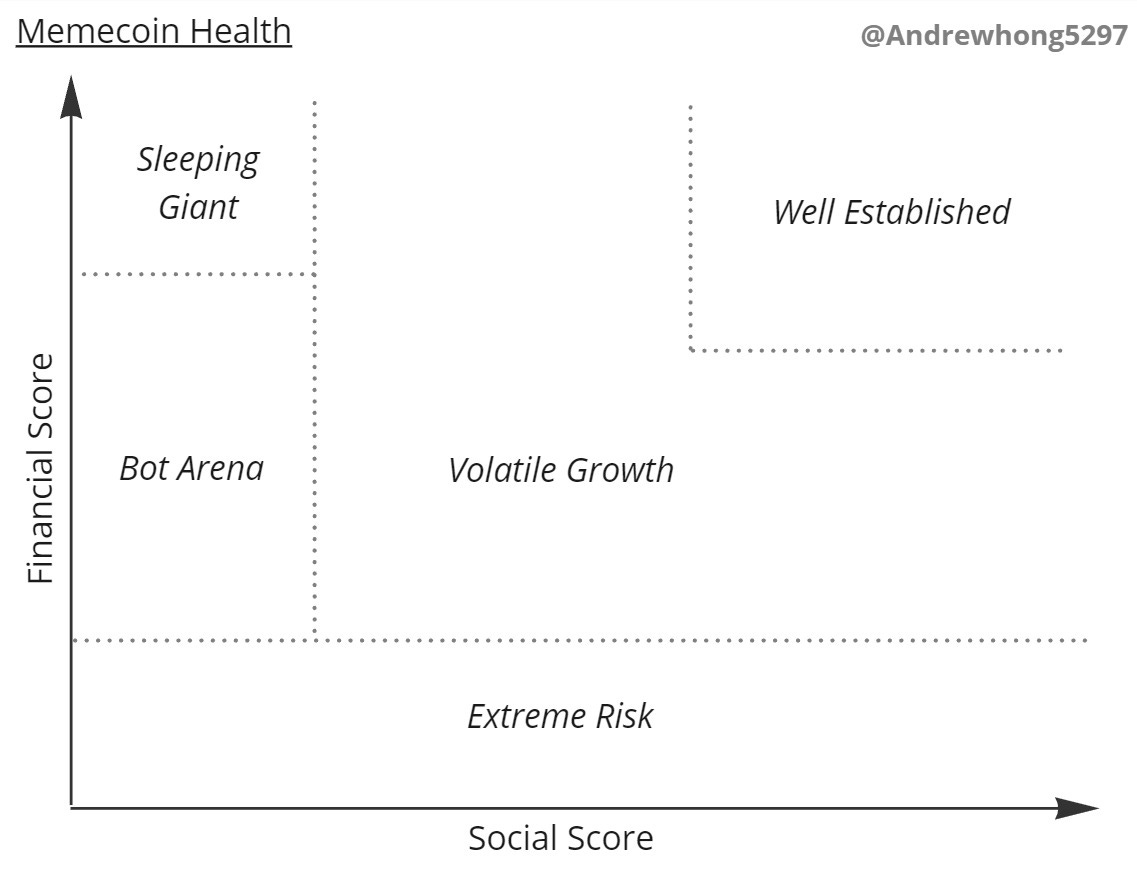
I’ve categorized five main areas in this chart:
- Extreme Risk: Memecoins with low liquidity and volume are very risky and subject to rugs (as likely there are only a few liquidity providers)
- Bot Arena: Most memecoins will never make it out of the trenches, where thousands of coins (many with the same token name/variation) are competing for social and financial attention
- Volatile Growth: Memecoins that do break out of their initial circles now have to sustain their momentum and growth. You’re likely to see many days of 100-500% swings in price in both directions, and also a bunch of influencers start to latch onto the meme.
- Well Established: The leaders will sit at the top socially and financially for a while, and be very clearly separated from the pack. It’s likely that the week to week numbers are less volatile, and attention is sustained as there is an equilibrium of inflows and outflows of people.
- Sleeping Giant: Memecoins that grew a lot socially and financially - and didn’t get rugged - may die down at sit in this corner for a while. Likely a DAO has formed, they’ve started shipping random mints or products, and are dealing with the mess of a community. All while hoping to rotating into the spotlight again.
The bulk of memecoins should be stuck in the “bot arena”, with a few catchy ones in the “volatile growth” segment, and maybe one or two making it “well established”. Along the way, some may lose social power and become “sleeping giants” and others may lose their financial backing (liquidity) to become “extreme risks”.
I believe that the average successful memecoin goes on a journey like this:
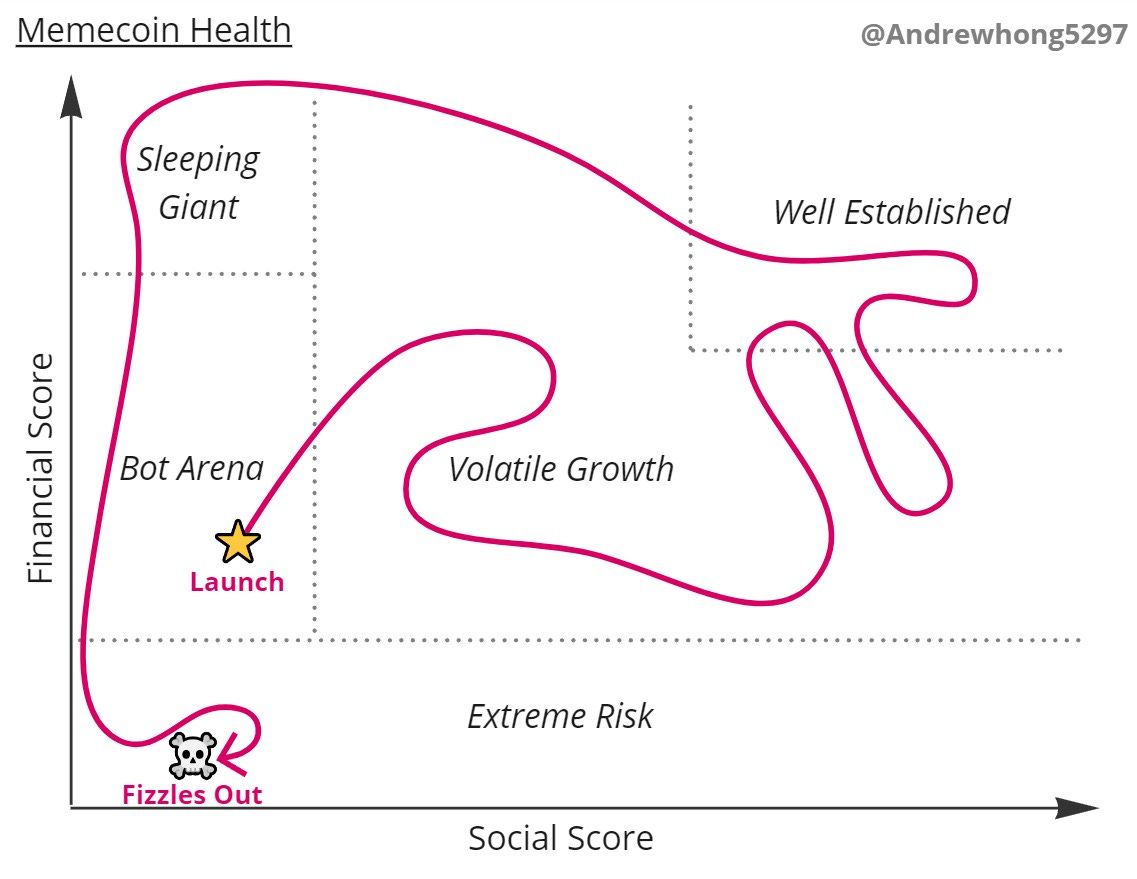
And you probably see many memecoins that get botted/influencer pushed to have a high social score, but has low financial score (liquidity) and leads to rugs.
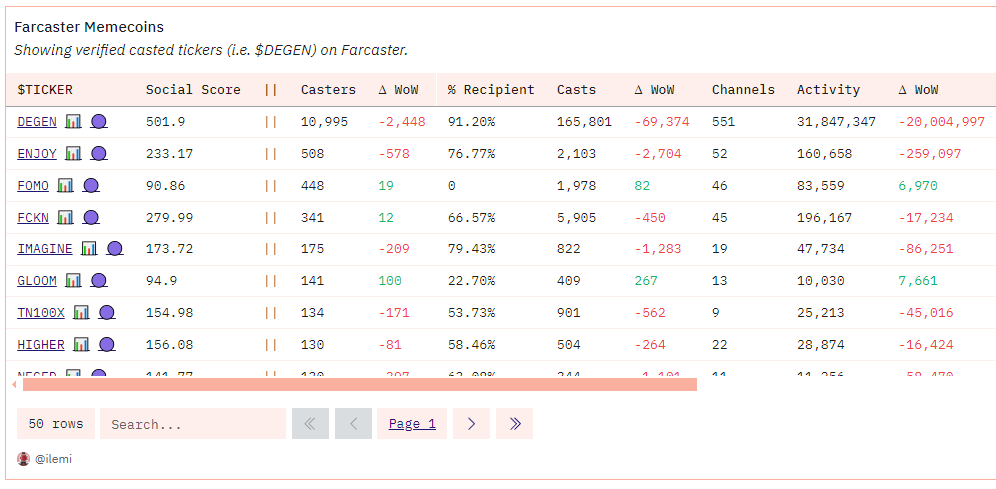
After much data engineering and cleaning, I was able to produce this chart in Dune focused on Farcaster memecoins:

https://dune.com/ilemi/social-memecoins
This actually fit my expectations pretty well, you have DEGEN far out in the top right corner and then a few others like ENJOY, HIGHER, TN100X, and EVERY out in the middle. Everyone else is stuck in the left competing for attention and liquidity.
It’s worth noting that I have not filtered out sybil/bots here, so social scores for some memecoins may be skewed. An improvement for the future!
Now, let’s walk backwards from this end chart to explain how those two scores were created. I’ll also pose further research questions and detail my query lineage for those who want to dig deeper.
Social Score
Each score is made up of a “base” component and a “growth” component. For the social score, we start by measuring the casts and engagement of ticker mentions. So “$DEGEN” will count but “DEGEN” won’t in this methodology.
That gives us five main columns:
- Casters: Number of people who have casted a given ticker
- % Recipients: Percent of those casters that have recieved the token before
- Casts: Number of casts with a given ticker
- Channels: Number of channels that had a cast with a given ticker
- Activity Level: The engagement (likes + replies) plus the casts times cube root of casters times cube root of channels.
The overall social score is calculated with the “base” being the activity level, and “growth” multipliers based on week over week change in unique casters and recipient casters. The idea here is that if you’re seeing large growth in people casting a ticker and those people buying/acquiring the token, that’s an extremely healthy sign.
Overall, it looks like this in a table:
https://dune.com/ilemi/social-memecoins
Financial Score
These are your main financial metric columns:
- Fully Diluted Value (FDV): Total supply multiplied by price
- Price: Most recent price based on DEX trades
- % DoD, WoW, MoM Price Change: Percent changes in price on a daily, weekly, and monthly basis
- Liquidity: This is non-token liquidity, meaning for a DEGEN-WETH pool we only count the WETH portion of it. It gives us a more stable sign of how much good liquidity there is for a given token.
- Trades: Number of DEX trades in last 30 days
- Transfers: Number of erc20 transfers in the last 30 days
- Total Volume: USD volume of DEX trades in last 7 days
The “base” for the financial score is its non-token liquidity and DEX volume, with a “growth” component based on week over week change in liquidity.
Overall, it looks like this in a table:

https://dune.com/ilemi/social-memecoins

All Comments