

Cointime

Download App
iOS & Android

Is Bitcoin going to $65K? Traders explain why they're still bearish

Bitcoin rebounded by as much as 14% after plunging to a four-month low near $76,600 on March 11. But BTC price is down approximately 25% from its record high of around $110,000, which is normal for a “bull market correction.”

Still, some analysts anticipate the Bitcoin price declines to continue in the future.

“Dark cloud” hints Bitcoin is topping out

Bitcoin faces renewed bearish pressure after rejecting at $87,470, the descending channel resistance, with a “dark cloud cover” pattern reinforcing the downtrend, according to an analysis shared by GDXTrader on X.

The dark cloud cover pattern occurs when a strong green candle is followed by a red candle that opens above the previous close but closes below the midpoint of the first candle’s body.

Such a shift in sentiment indicates that buyers attempted to push higher but were overpowered by sellers, often leading to further downside.

Bitcoin's failure to close within the $90,000-$93,000 resistance zone suggests a lack of buying conviction, GDXTrader noted, saying the cryptocurrency will remain under bearish pressure unless it decisively breaks above the said range.

BTC price “perfect rejection” risks $65,000

Bitcoin’s potential to decline further arises from its “perfect rejection” after testing the $86,000-88,000 zone as resistance, according to analysis from popular trader CrediBULL Crypto.

Notably, Bitcoin attempted to break toward the local supply zone marked in red but failed to sustain above the said resistance zone, illustrated by the orange circle in the chart below.

Failure to reclaim the supply zone has increased the probability of a drop toward lower support levels around $77,000-79,000 (highlighted in green) by March. Testing this area as support has led to sharp price rebounds in March.

Nonetheless, if this support zone breaks, a deeper move below the $77,000-79,000 region could extend toward the $65,000-74,000 area—the larger green liquidity zone in the chart above—by April.

Analyst George shared a similar outlook, as shown below.

“Hard to stay bullish” with a bear flag pattern

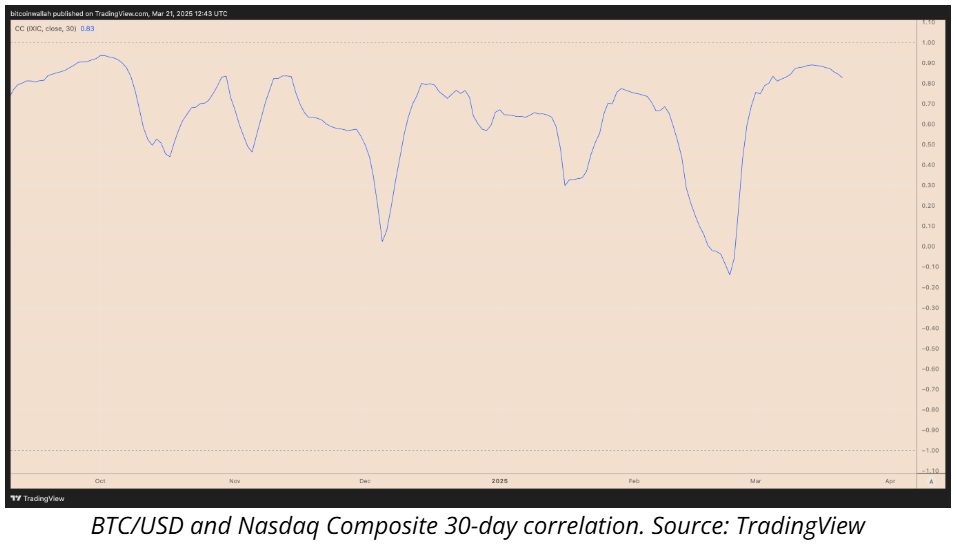
According to analyst CryptOpus, Bitcoin remains tightly correlated with traditional equity markets, particularly the S&P 500 (SPX) and Nasdaq 100 (NDX), both of which are displaying bear flag patterns on the charts.

A bear flag forms when the price consolidates higher inside an ascending parallel channel. It resolves if the price breaks below the lower trendline and drops by as much as the previous downtrend’s height.

BTC is following a similar bear flag structure, with $84,000 acting as the lower trendline support. A break below this threshold could trigger a deeper sell-off toward $72,000 per the technical rule explained above.

Moreover, Bitcoin's correlation with equities has grown due to a broader decline in risk-on sentiment, led by the US President Donald Trump’s global trade war.
Arthur Breitman, the co-founder of Tezos, has called US recession one of the crypto market’s biggest external risks.

Comments

All Comments

Recommended for you

  • Trump Shares Op-Ed Claiming He is Winning the War Against Iran

    On August 29, U.S. President Trump shared a commentary article from the New York Post on Truth Social on Saturday, which stated that he is winning the war against Iran and should maintain the current strategy. The title of the article Trump shared read: 'Trump is Winning the War Against Iran - Stay the Course.'

  • Morgan Stanley: 2028 as a Key Observation Point for Global Memory Competition Landscape

    On August 29, Morgan Stanley pointed out that the rise of Chinese memory manufacturers should not be viewed merely as a technological catch-up or low-cost substitution; what is truly noteworthy is that their production capacity may gradually become large enough to alter the supply structure of the global memory market. Changxin Technology and Yangtze Memory Technologies are currently entering the mainstream product market and gradually extending into high-profit markets such as HBM, high-end server DRAM, and enterprise SSDs. Morgan Stanley considers 2028 as an important observation point for the global memory competition landscape. From 2026 to 2027, demand for AI servers, capacity crowding of advanced wafers by HBM, import substitution, and the time required for customer certification may absorb most of the new supply from Chinese memory manufacturers. By 2028, as Chinese manufacturers expand production, the additional capacity from Samsung, SK Hynix, and Micron, which had previously initiated expansions, will also be released. At that time, the supply variables in the global memory market will significantly increase. Morgan Stanley estimates that Changxin's DRAM monthly production capacity will rise from 180,000 wafers in 2025 to 300,000 in 2026, accounting for approximately 13% of global DRAM wafer capacity and about 11% of bit shipments; by 2028, it is expected to further increase to 500,000 wafers, and by 2031, it could reach 800,000 wafers. If the expansion proceeds smoothly, Changxin's global DRAM bit shipment market share could approach 15% by 2030, and it may even have the opportunity to surpass Micron in production capacity around 2028, becoming the third-largest DRAM supplier in the world.

  • US Spot Ethereum ETF Sees Net Inflow of $102.17 Million Yesterday

    On August 29, according to monitoring by Trader T, the US spot Ethereum ETF recorded a net inflow of $102.17 million yesterday.

  • US Spot Ethereum ETF Sees Net Inflow of $102.17 Million

    On August 29, according to monitoring by Trader T, the US spot Ethereum ETF experienced a net inflow of $102.17 million yesterday.

  • US Spot Bitcoin ETF Sees Net Outflow of $201.81 Million

    On August 29, according to monitoring by Trader T, the US spot Bitcoin ETF experienced a net outflow of $201.81 million yesterday.

  • US Spot Bitcoin ETF Sees Net Outflow of $201.81 Million Yesterday

    On August 29, according to monitoring by Trader T, the US spot Bitcoin ETF experienced a net outflow of $201.81 million yesterday.

  • BTC Surpasses $78,000

    Market data shows that BTC has surpassed $78,000, currently priced at $78,009.49. The 24-hour decline has narrowed to 3.23%. Due to significant market fluctuations, please ensure proper risk management.

  • BTC Surpasses $78,000

    Market data shows that BTC has surpassed $78,000, currently priced at $78,009.49, with a 24-hour decline narrowing to 3.23%. The market is experiencing significant volatility, so please ensure proper risk management.

  • BTC Briefly Drops Below $77,000

    Market data shows that BTC briefly fell below $77,000, currently reported at $77,694, with a 24-hour decline of 3.3%. The market is experiencing significant volatility, so please ensure proper risk management.
