

October has brought implied volatility back into the mid-50s once again, as strong demand for participation in any further upwards moves sees the skew of both majors volatility smiles move further towards calls. Despite the strong anticipation, however, realised volatility remains very close to historical lows. This leaves the volatility ratio of both BTC and ETH options at its highest since 2019, a spread that we believe cannot be attributed entirely to ETF speculation.
Relative Vol Levels
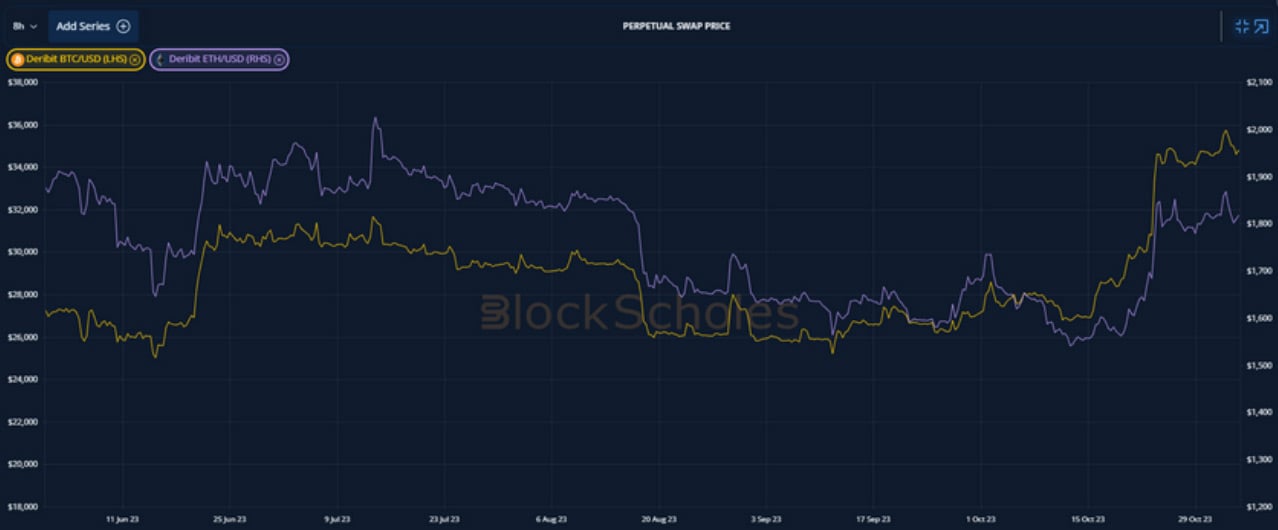
Figure 1 8-Hourly perpetual swap mark price for BTC (yellow) and ETH (purple) since 1st June 23. Source: Block Scholes
ETF speculation, liquidations, and a possible gamma squeeze suffered by dealers who had been caught short volatility all combined in October, causing BTC spot prices to make another step change to $35K. Despite making ground on paring the losses sustained in mid-August, ETH’s spot price lags below the psychological level of $2K that it enjoyed the last time we saw a bitcoin change hands for more than $30K.
BTC’s out-sized move took its 90-day realised volatility 1.1 times higher than ETH’s – something we have not seen since 2019, and never before at such a high multiple. The two assets had previously delivered equal levels of volatility to each other between March and June this year following the US banking crisis, so it is notable that BTC volatility is dominant during yet another period of increasing macroeconomic uncertainty. This is the most extreme development in a trend that began following the Merge in September of last year, which we have highlighted in previous month’s commentaries.
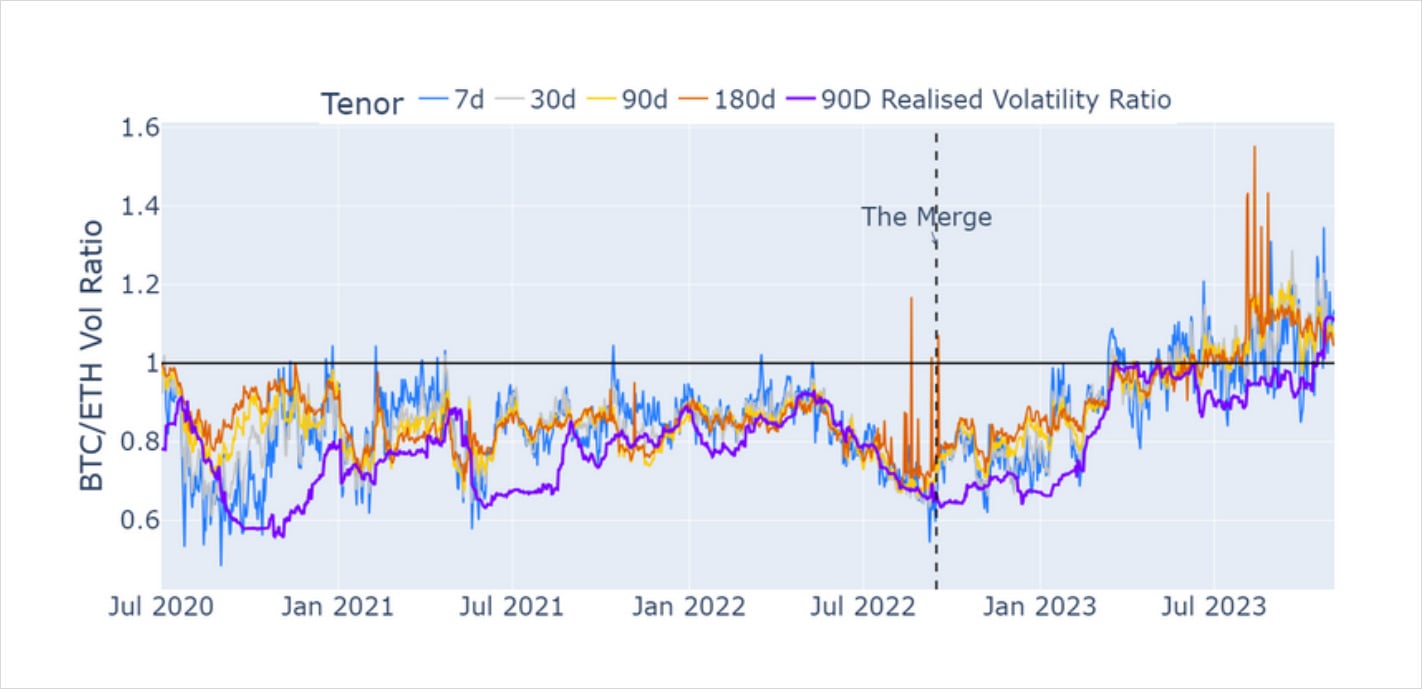
Figure 2 Daily ratio of BTC to ETH ATM volatility at 7-day (blue), 30-day (grey), 90-day (yellow), and 180-day (orange) tenors, with the ratio of BTC’s to ETH’s 90-day realised volatility since Jul 2020. Source: Block Scholes
The increase in BTC’s vol relative to ETH’s had been priced for by options markets since June of this year, when the forward-looking volatility ratio that was implied by options prices crossed above 1 while the realised volatility ratio remained “stuck” below. Now, the actual and expected relative volatility levels are once again in line with each other.
Still at the Lows
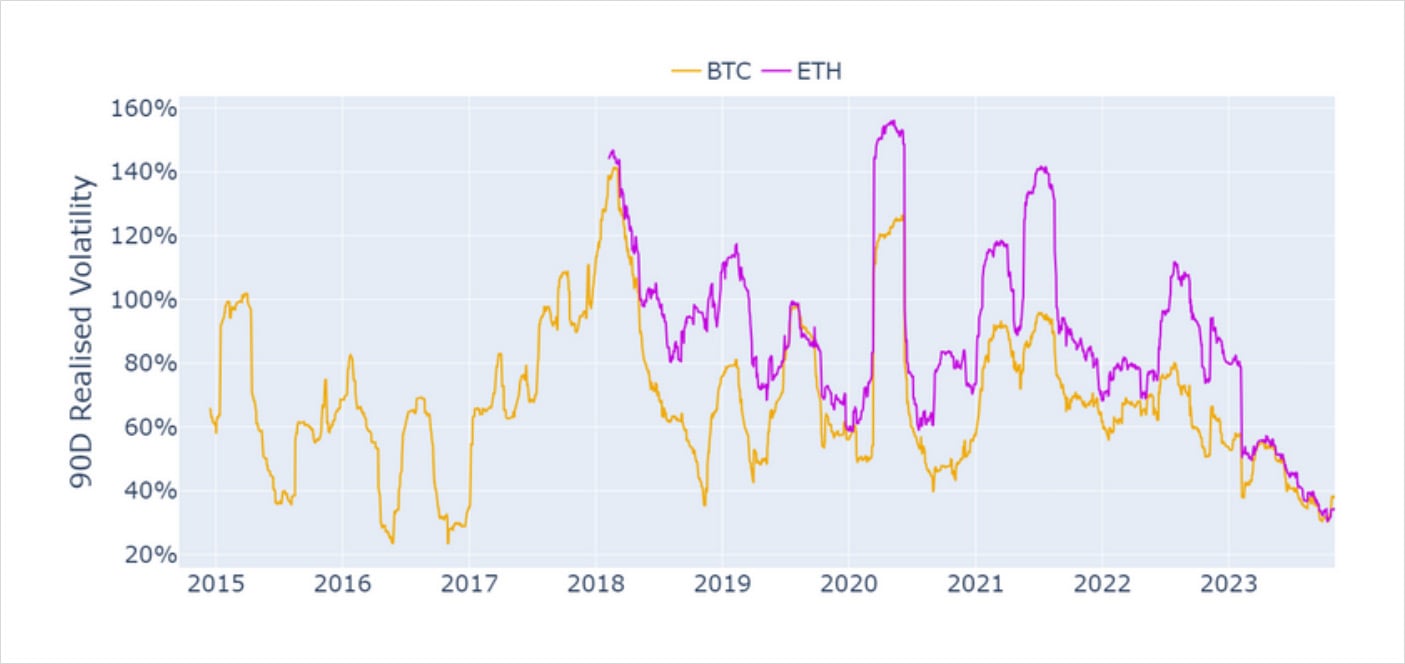
Figure 3 Daily estimate of BTC’s (yellow) and ETH’s (purple) 90-day realised volatility volatility from the earliest available spot market price data. Source: Block Scholes
Although the ratio of BTC’s volatility to ETH’s is at an all-time high, the outright level of realised volatility for both assets is at an all-time low. Delivered volatility has been on a consistent downward trend since as early as mid-2021, corresponding with a similar decline in spot trading volumes. BTC’s mid-October jump has done little to reverse the years-long trend downwards of crypto-asset volatility levels. It has, however, returned implied volatility levels back to the mid-50s.
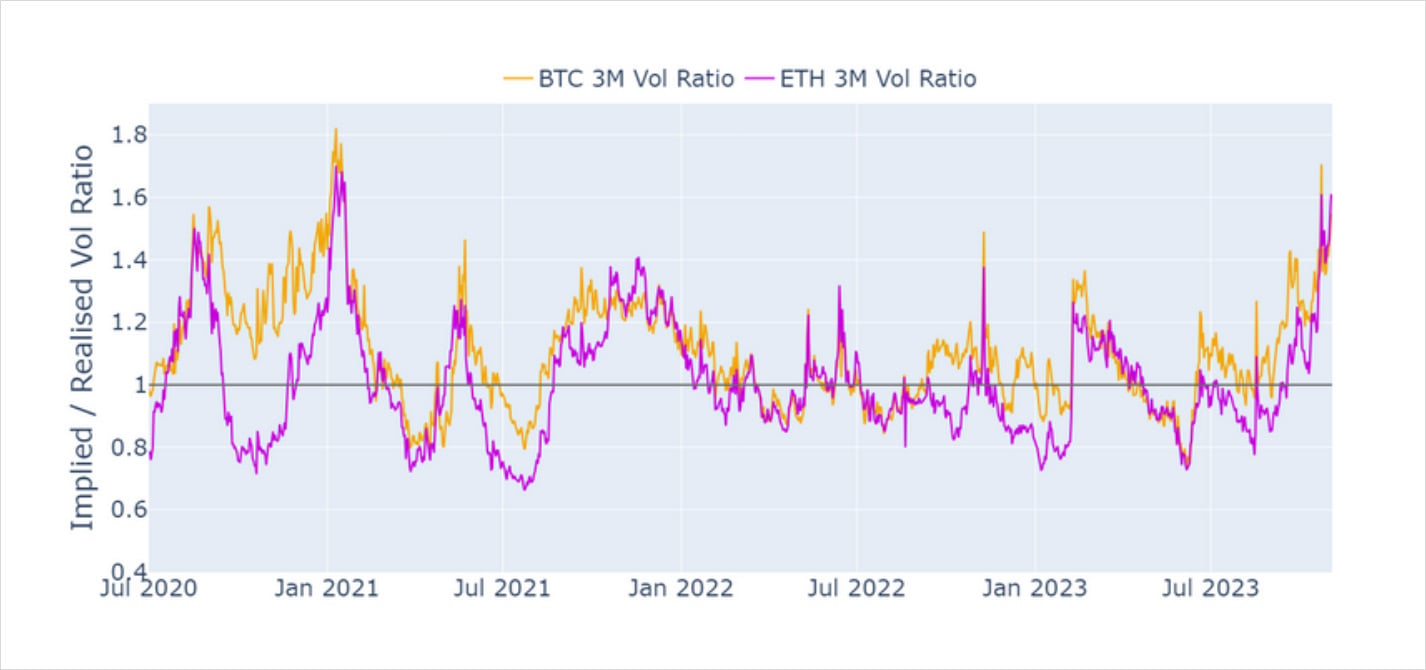
Figure 4 Daily ratio of BTC’s (yellow) and ETH’s (purple) 90-day tenor implied volatility to their 90-day realised volatility from 1st July 2020. Source: Block Scholes
This leaves the volatility market at an interesting juncture. Volatility expectations are strong, leading to a large spread between the forward-looking levels that are priced for by options markets and the level of volatility with which spot prices have been moving. That spread is at its widest since January 2021, but the current level of uncertainty across all assets – not to mention those uncertainty factors specific to crypto-assets and BTC – explains at least some of the high demand for optionality.
Out-Performance in Calls
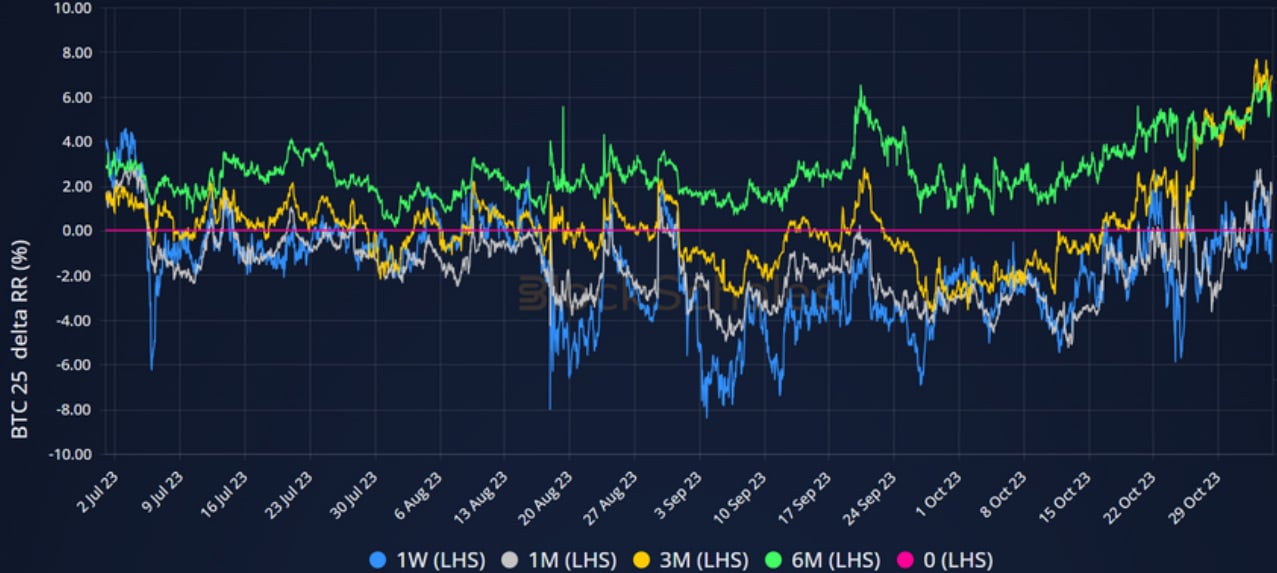
Figure 5 Hourly 1-month tenor, 25-delta risk-reversal (spread of call IV above put IV) at several key tenors from 1st July 2023. Source: Block Scholes
Bullish price action in October saw a recovery in the skew of BTC’s volatility smiles from leaning towards OTM puts to a more balanced tilt with a small preference for upside participation at longer tenors. The smile-wide rise in implied volatility has lifted calls and puts alike, but the move in skew towards a more neutral smile means that the volatility priced for by OTM calls has risen faster. This is easier to see if we normalise put and call IV by the concurrent level of ATM vol.

Figure 6 Hourly ratio of 25-delta call (blue) and put (pink) implied volatility to the ATM level, each at a 1-month tenor from 1st July 2023. Source: Block Scholes
October’s rise in implied vol can be very clearly associated with renewed buying of OTM calls ahead of anticipated ETF-inspired bullish price action. Relative to the at-the-money level, the volatility of OTM puts began to fall after reaching a near year-long peak on the 13th of October, just before the beginning of the most recent spot price rally. Renewed conviction of an ETF appears to have led many to ramp up their bullish positioning in options.
Just ETF Anticipation?
Several macroeconomic factors are being largely ignored (such as the risk of a spiralling war in the Middle East, potential risks to the upside for inflation, and the apparent end of the tightening cycle in key advanced economies) as the driver of price action has been largely attributed to spot ETF uncertainty. As such, the most recent rush to increase bullish positioning in options (with dealers getting caught short on vol and contributing to the push higher in spot) that is evidenced by the out- performance in calls, leaves crypto-asset volatility markets in a tense “wait-and-see” mode.
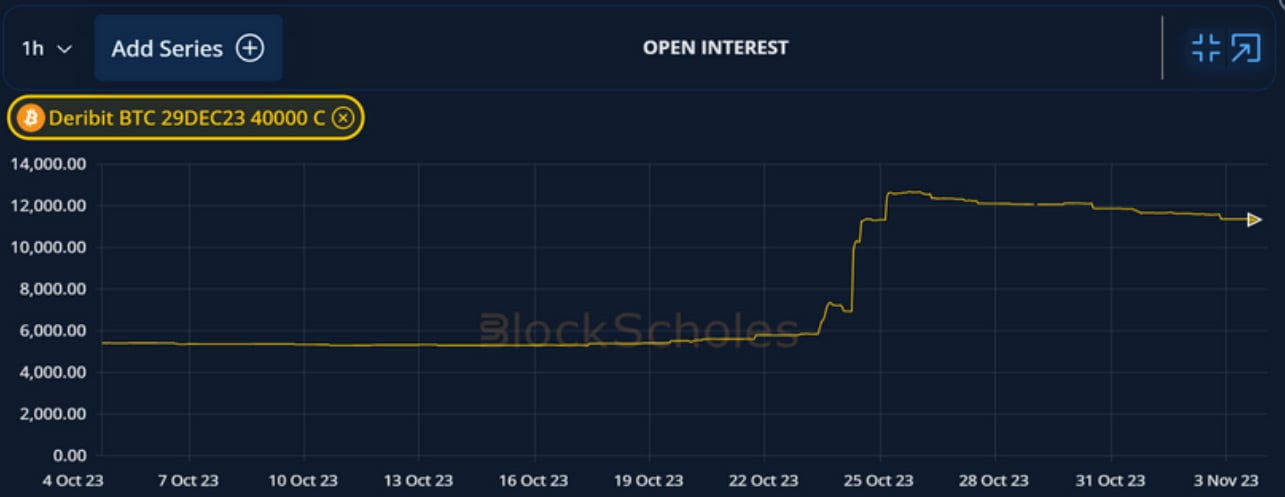
Figure 7 Open interest of the BTC-29DEC23-40000-C contract on Deribit, as measured by the number of contracts since the 4th October 2023. Source: Block Scholes
However, we note that ETH enjoys a similarly high volatility ratio, despite it’s under-performance in spot. This makes it difficult to attribute the entirety of that premium to ETF anticipation, despite the high correlation between the two majors. This most recent rally is evidence of that, with ETH posting just 17% in comparison to BTC’s 29%. How large will that discrepancy be following the approval of a spot BTC ETF?

Figure 8 Daily ratio of 3-month tenor ATM implied volatility to 90-day realised volatility for BTC (yellow) and ETH (purple) before and after Ethereum’s Merge on the 15th September 2022. Source: Block Scholes
It is also tempting to consider the ETF saga as analogous to last year’s switch of Ethereum’s consensus mechanism to Proof of Stake. A highly anticipated event is dominating the token’s narrative despite a wider macroeconomic backdrop that would otherwise continue to drive price action. However, there are some key differences.
This time around, certainty of the deadline of the event has been traded for, in our view, unwarranted levels of certainty of both its success and the longer-term bullish sentiment that it would herald. In addition, before the Merge we did not see ETH’s implied-to-realised volatility ratio rise above 1 leading into the event as it has recently for BTC, although both premia tracked each other closely before the event. The divergence that began immediately after is a more likely guide to the ETF dilemma, although perhaps across a longer time horizon. Increased institutional access to BTC is likely to add a new factor to its volatility and further decouple its narrative from ETH’s.


All Comments