
From cointelegraph by Yashu Gola
Solana is on the verge of wiping out the entire gains it post-Donald Trump’s reelection in November.
On Feb. 24, the SOL/USD trading pair dropped 7.35% to reach $157.25, its lowest point since Nov. 6.
These losses are part of a broader correction that began on Jan. 19, when SOL reached its all-time high of $295.31. Since then, the price has tumbled 47%.

Key catalysts driving the SOL prices lower include:
- Solana’s alleged links with North Korea’s Lazarus Group.
- An upcoming SOL token unlocking event.
- Negative SOL funding rates.
Solana’s alleged ties with Bybit hackers
Solana's price is down today amid growing concerns over its association with high-profile hacks and memecoin scams.
Things to know:
- The $1.4 billion Bybit hack on Feb. 21 has been linked to North Korea’s Lazarus Group, a notorious hacking organization.
- Onchain investigator ZachXBT found that wallets tied to the Bybit hack were also involved in Solana-based memecoin scams, particularly “rug pulls” on Pump.fun.

- The same wallets were linked to the $29 million Phemex hack in January, indicating a pattern of fraudulent activity exploiting Solana’s ecosystem.
- Solana has been plagued by memecoin scams, including the $107 million rug pull of the Libra token, leading to a decline in user trust and capital inflows.
- The combination of hacks, scams, and negative sentiment is reducing trading activity and weakening demand for SOL, contributing to today’s price decline.
Related: ETF approval will help Solana break the ‘memechain’ narrative
Top Solana memecoins, such as Official Trump (TRUMP), Bonk (BONK), and Dogwifhat (WIF), have suffered huge losses on 24-hour and 7-day adjusted timeframes, as shown below.
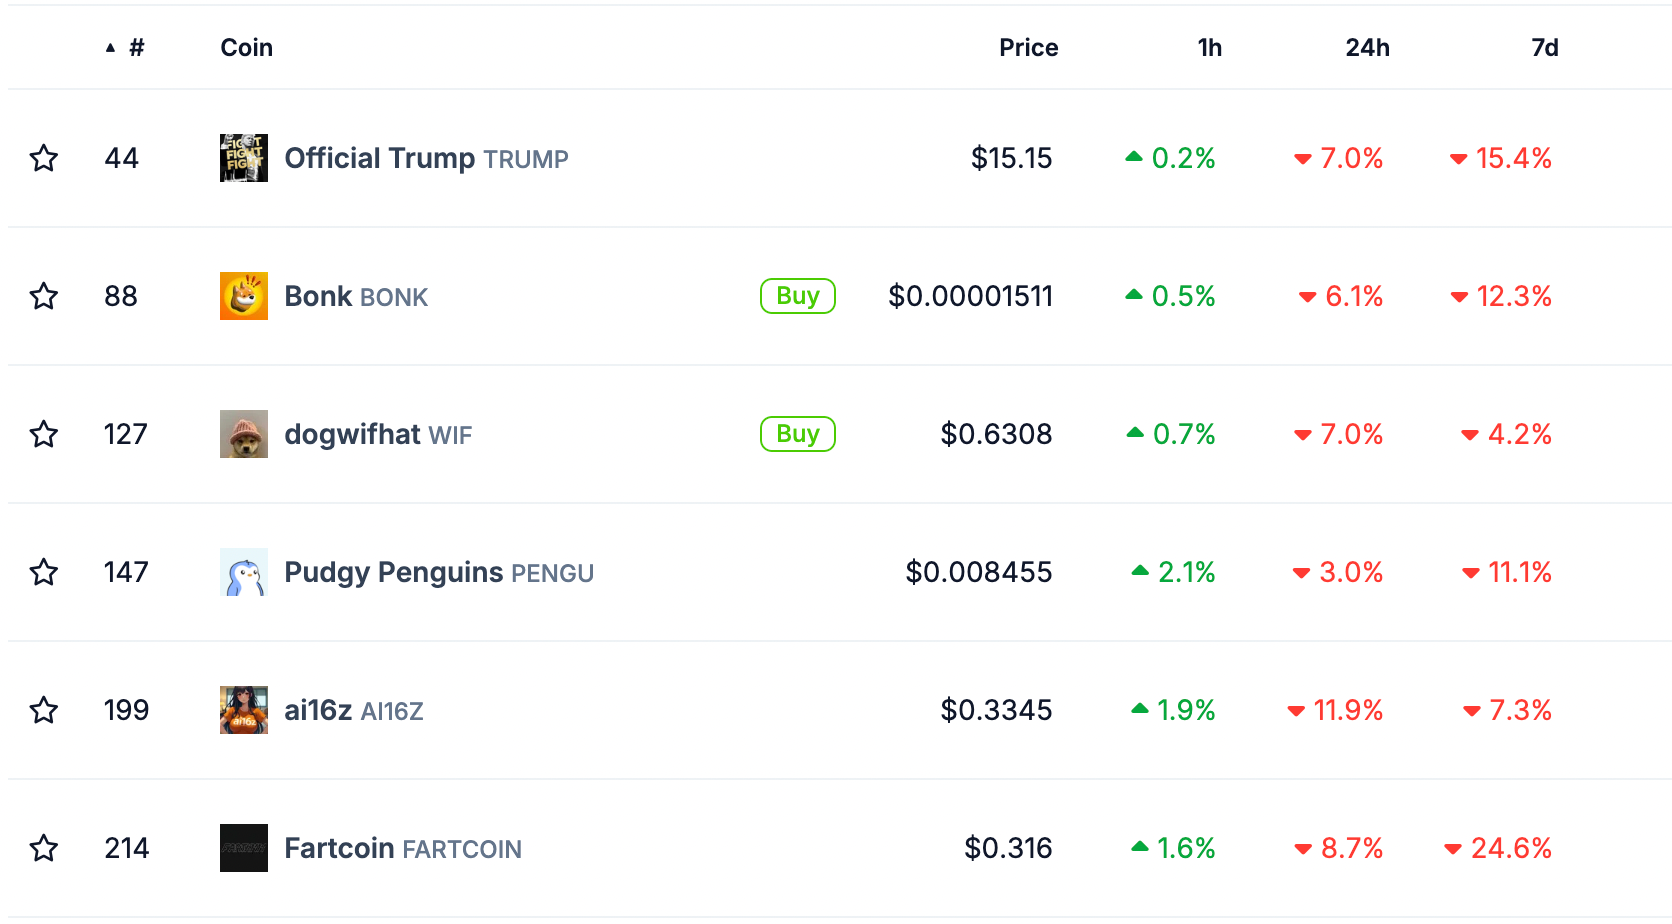
Key points:
- Memecoins drive a large portion of Solana’s transaction volume.
- Fewer transactions mean less demand for SOL to pay network fees.
- Traders previously bought SOL to trade memecoins, stake, or provide liquidity.
- A memecoin slowdown reduces SOL purchases, decreasing buying pressure.
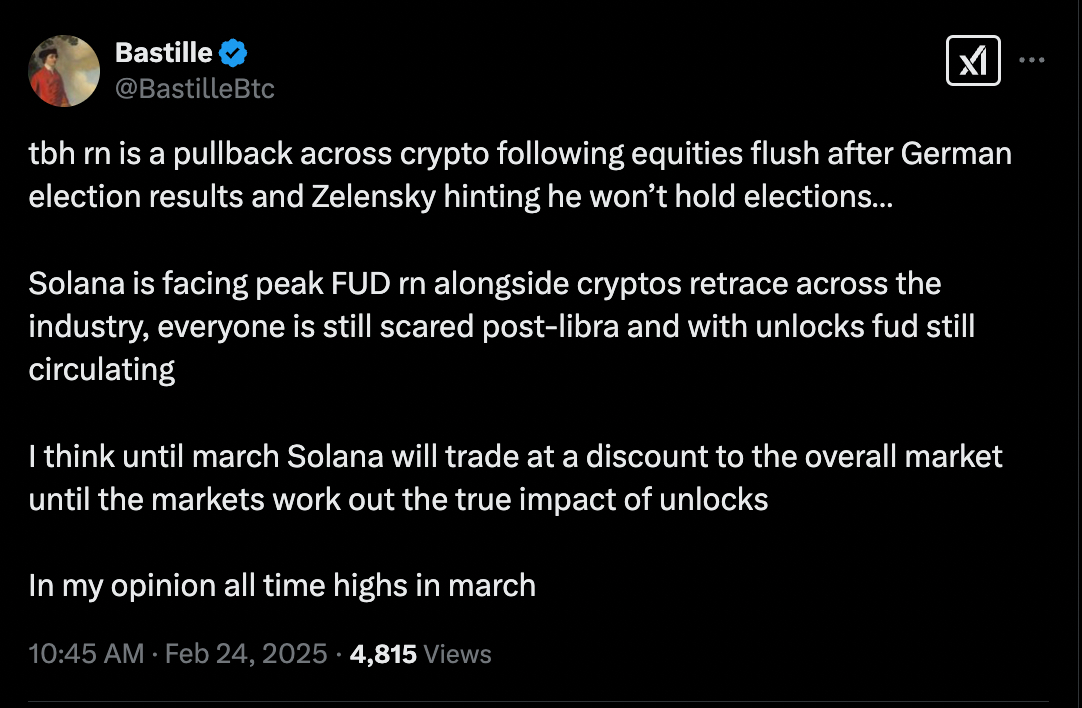
Solana faces “peak FUD” from token unlock
SOL’s price declines appear ahead of its upcoming token unlocking event.
What to know:
- 11.16M SOL (~$1.79 billion) are set to be released on March 1, primarily from the FTX estate.
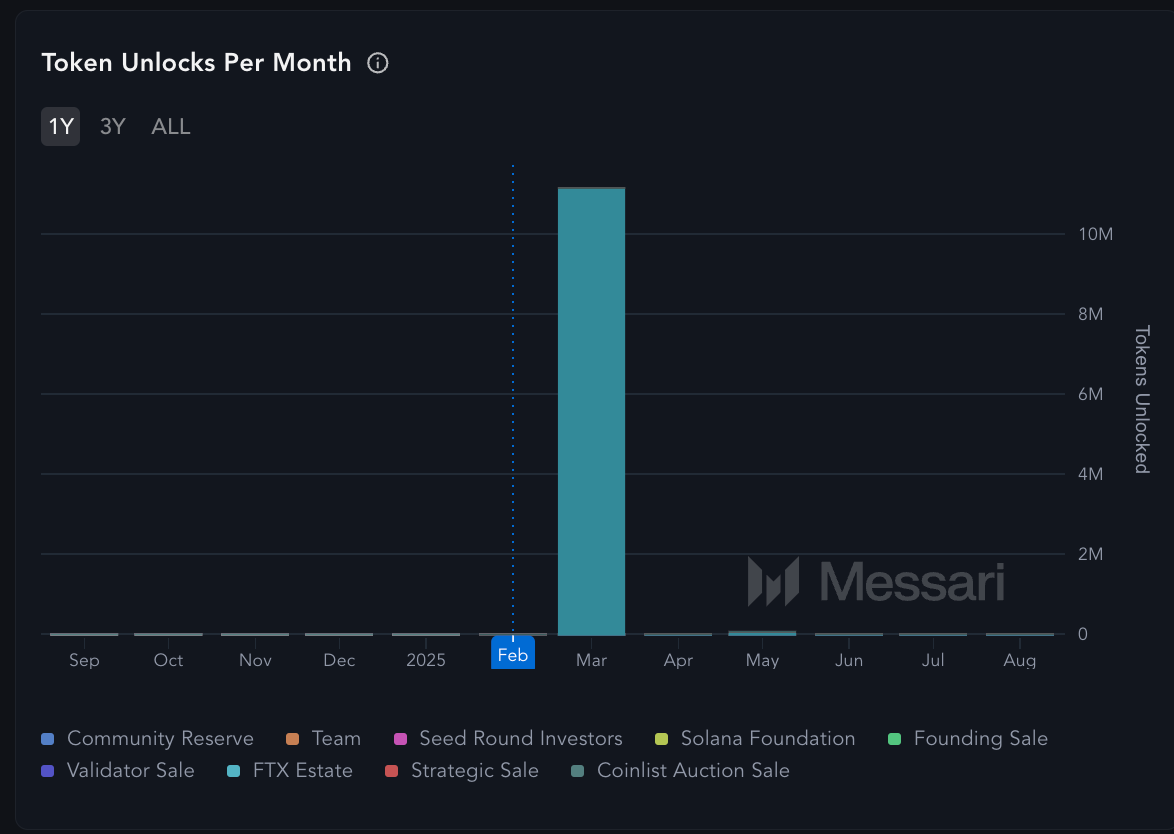
- Concerns over increased sell pressure are high as the FTX estate may liquidate its holdings, increasing supply.
- Market uncertainty about how much of the unlocked SOL will be sold is leading to cautious trading and risk aversion.
- Investors preemptively pricing in the unlock impact is causing SOL to underperform ahead of the event.
Solana’s funding rates go negative
Solana's open interest (OI) is decreasing, and its funding rates are negative, which provides crucial insight into why SOL’s price is falling.
Key points:
- Solana’s OI in the futures market has dripped from its local peak of $8.57 billion on Jan. 17 to $5.11 billion as of Feb. 24.
- OI measures the total number of outstanding futures contracts, and a decrease suggests more traders are exiting positions.
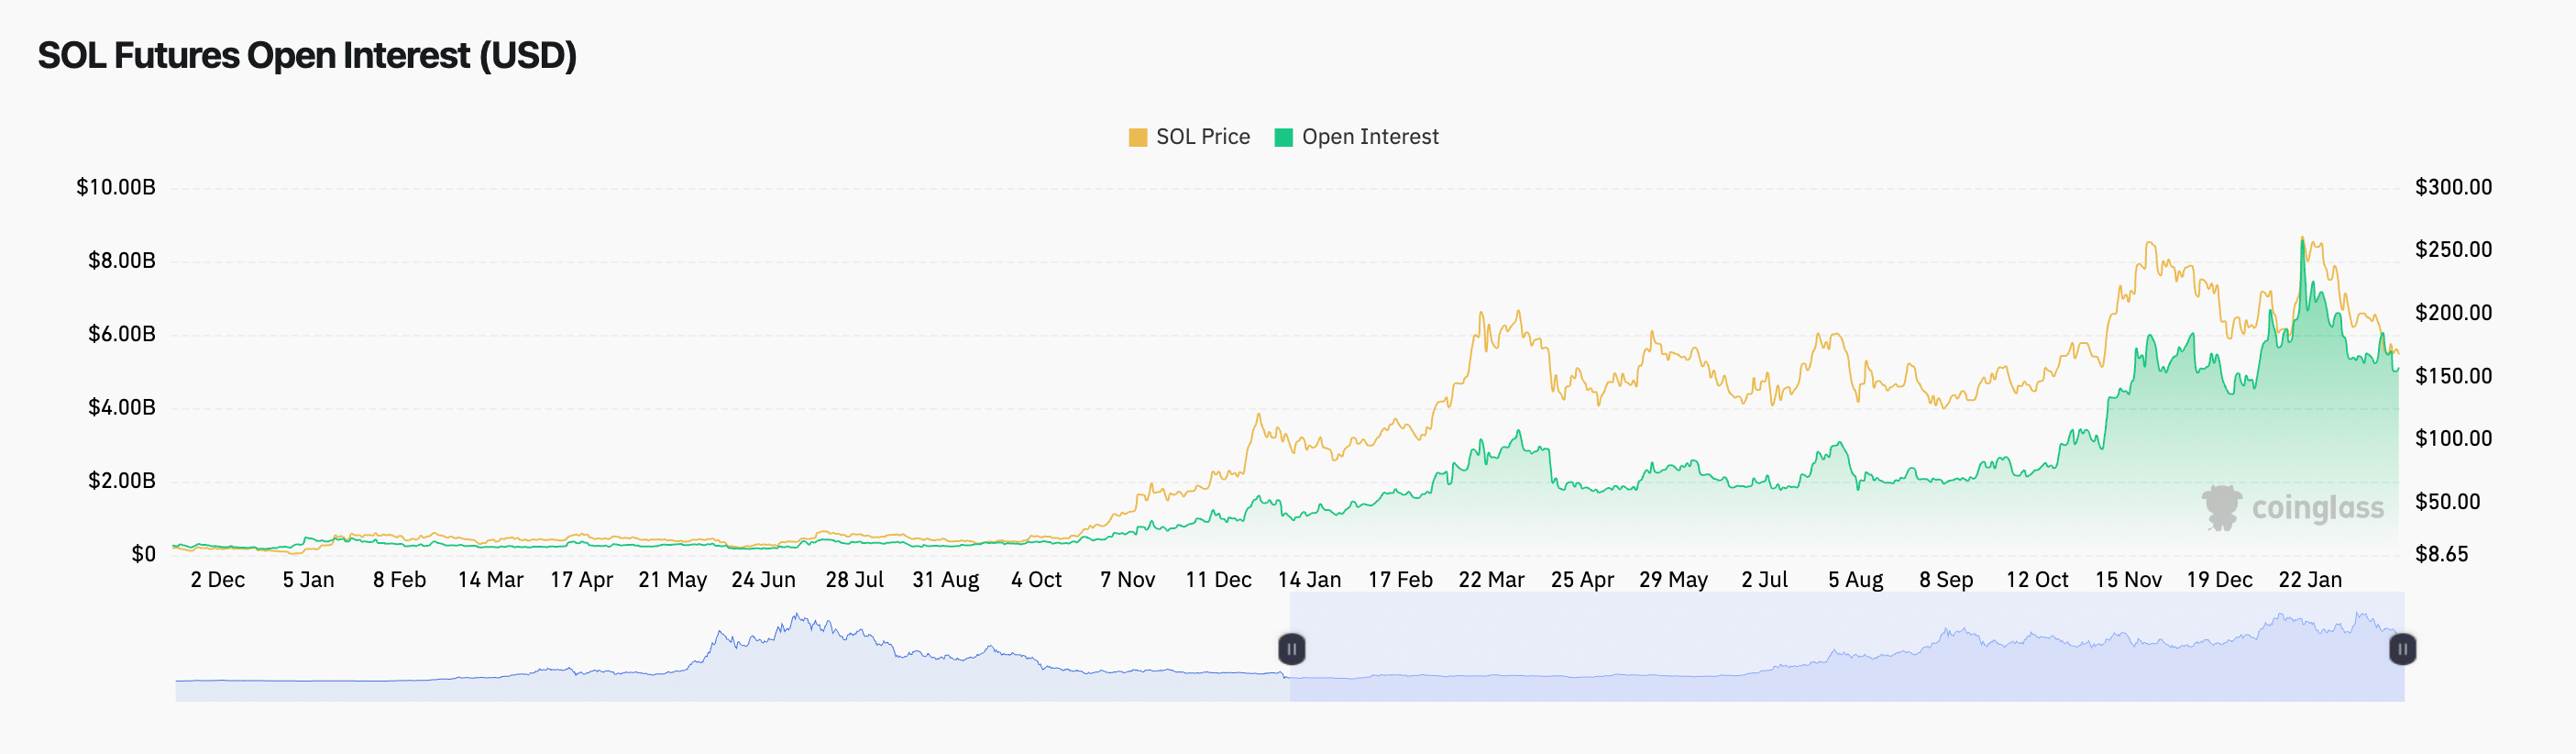
- A declining OI typically means reduced speculative demand, slowing upward price momentum.
- Meanwhile, SOL’s weekly funding rates dropped to -0.48% on Feb. 24 compared to 0.354% two days ago.
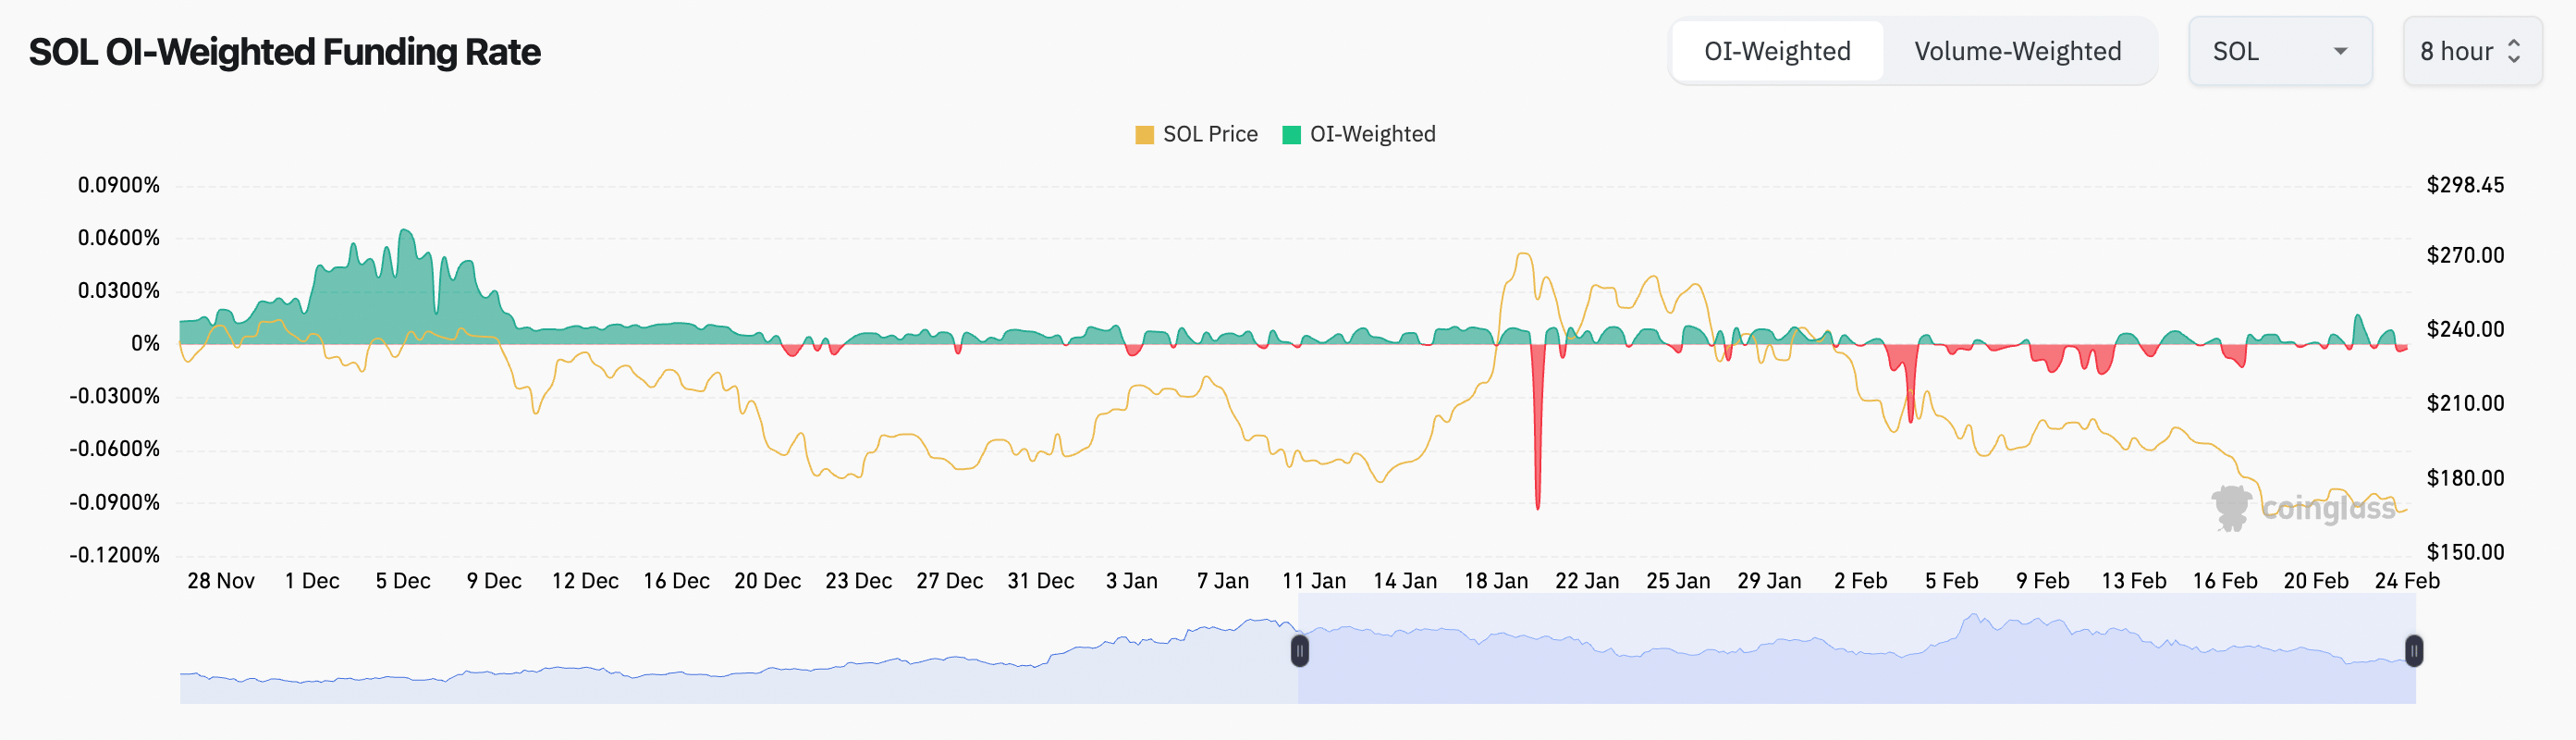
- Negative funding means shorts are paying longs to keep their positions open.
- OI decline combined with negative funding rates shows a lack of confidence in SOL’s short-term price action, increasing the likelihood of further downside.
Solana eyes another 30% drop
Solana’s price drop appears to be part of its prevailing head-and-shoulders (H&S) pattern.
Note that:
- An H&S pattern consists of three peaks: a higher central peak (head) flanked by two lower peaks (shoulders), with a common support level (neckline).
- The target price is estimated by measuring the distance from the head’s peak to the neckline and subtracting it from the neckline’s breakdown level.
- As of Feb. 24, SOL had entered the pattern’s breakdown stage after dropping below its neckline support of around $177.
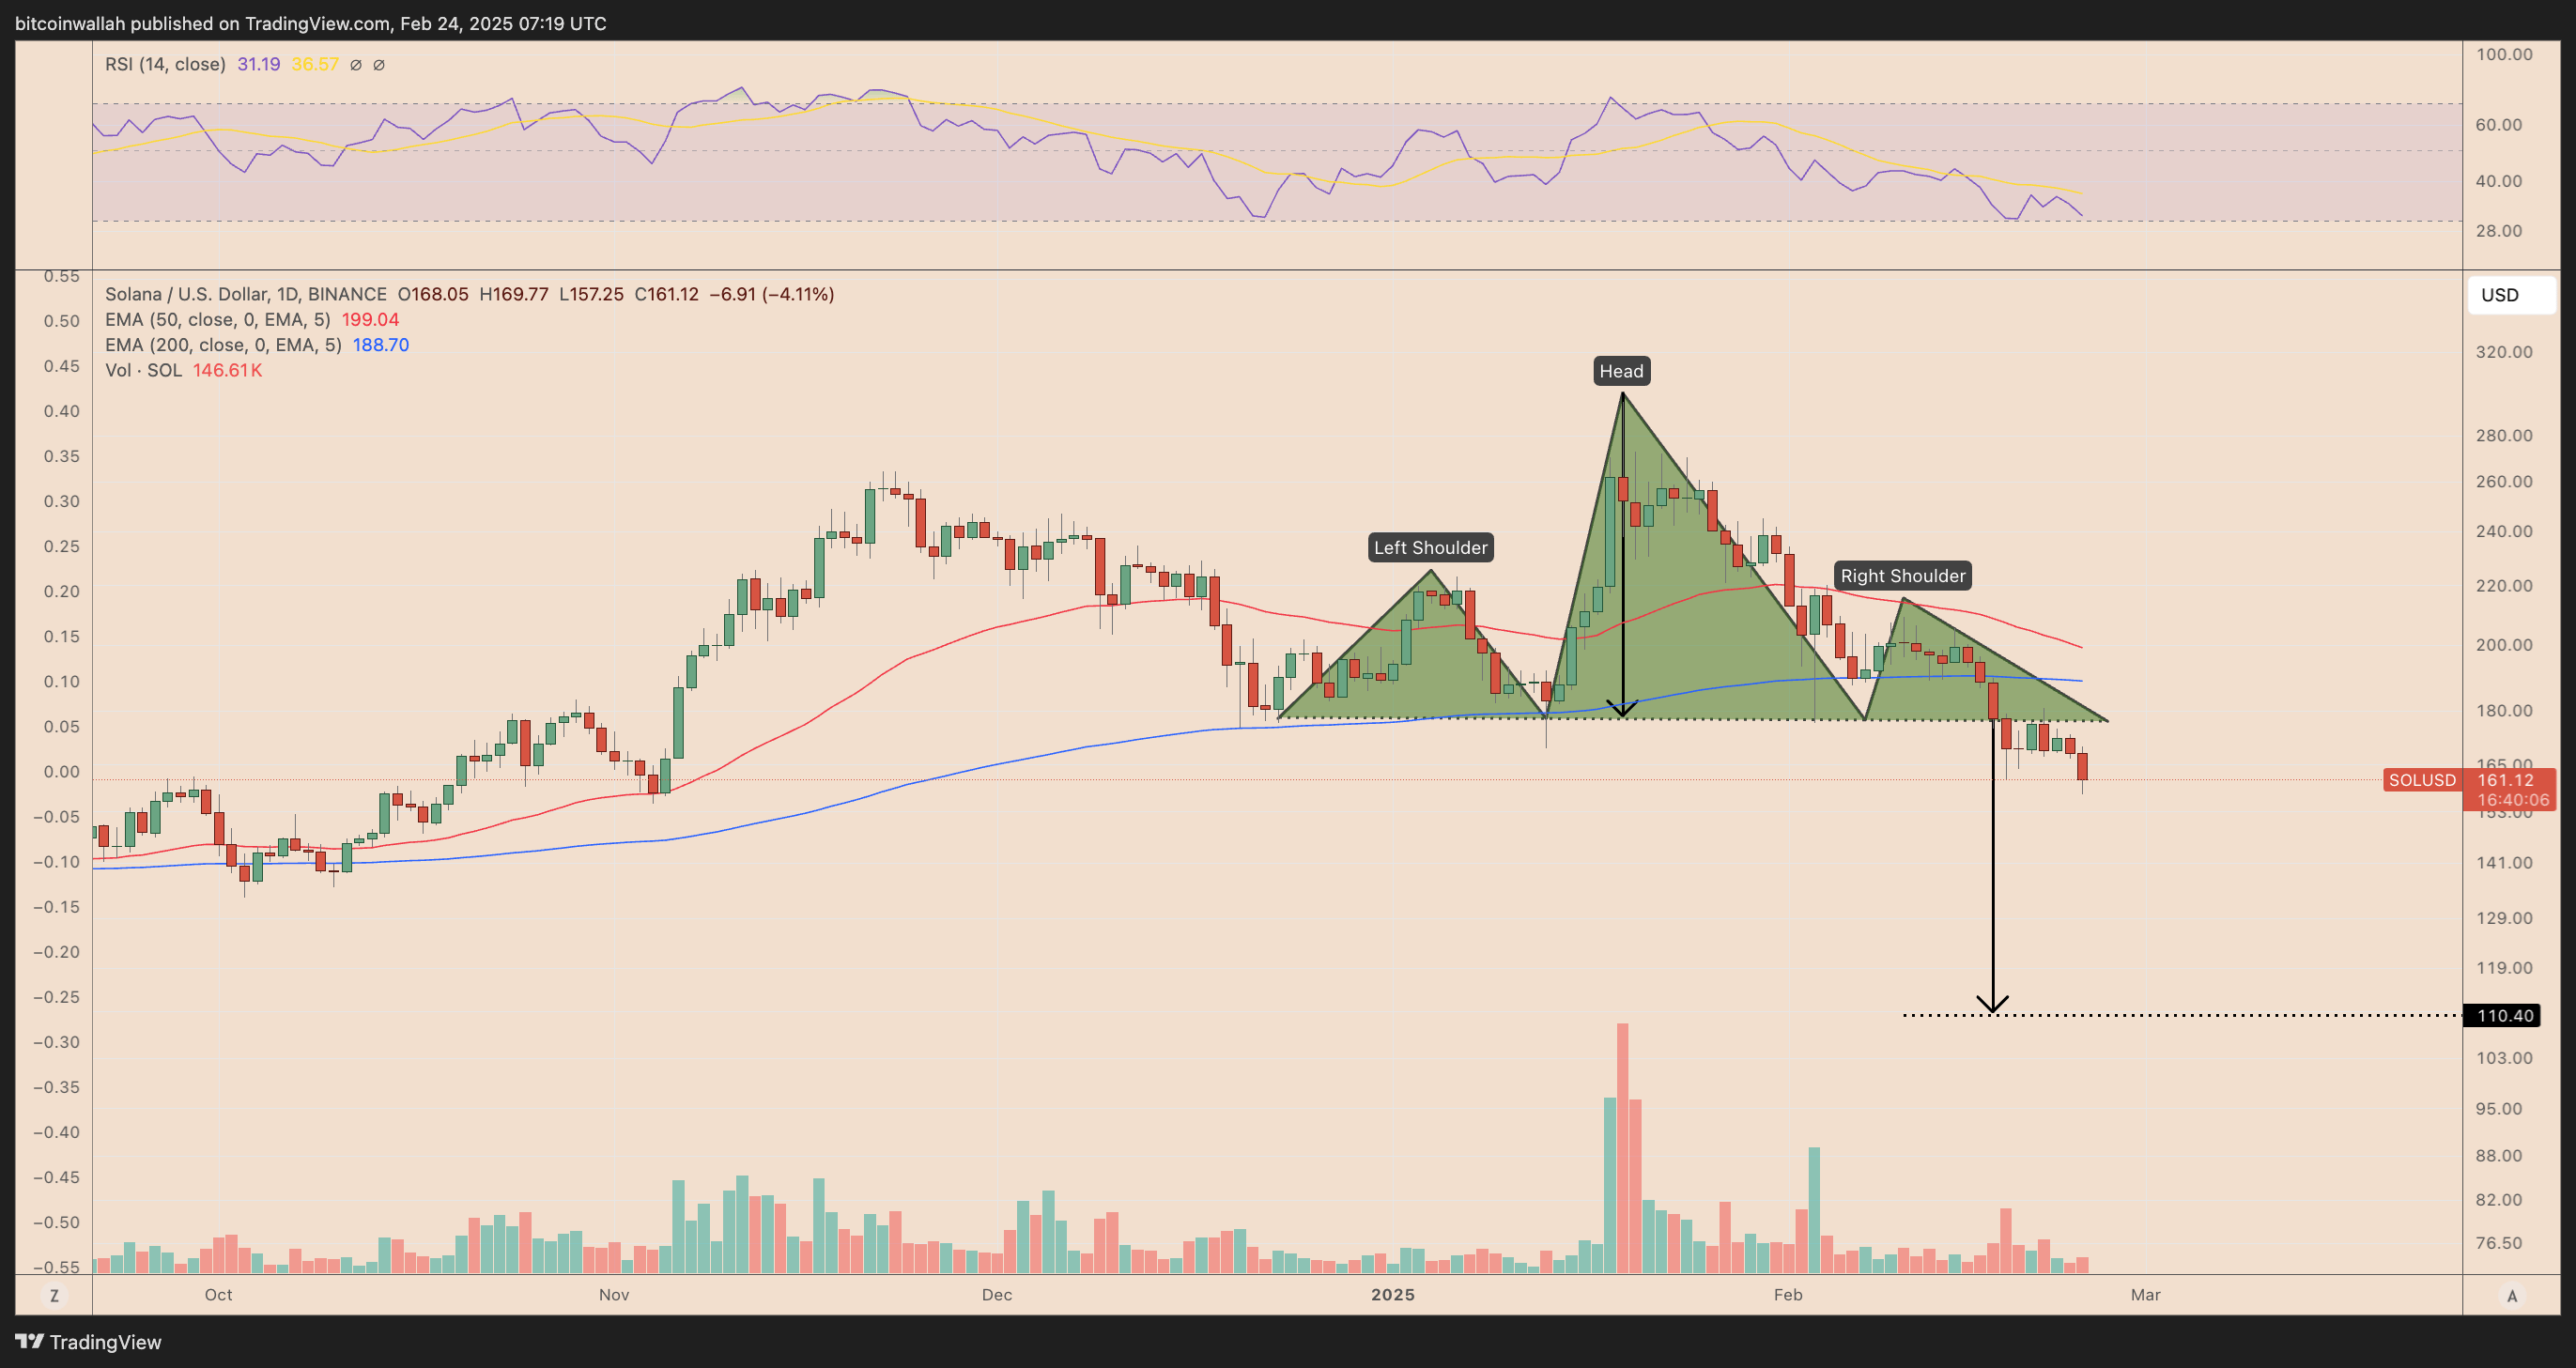
- A decisive breakdown below $$177 increases the risks of Solana price dropping toward the H&S target of around $110, down by over 30% from current prices.
- However, if SOL reclaims the neckline as support, a potential recovery toward the local high of $215 could follow, invalidating the H&S outlook.


All Comments