
From cointelegraph by Yashu Gola
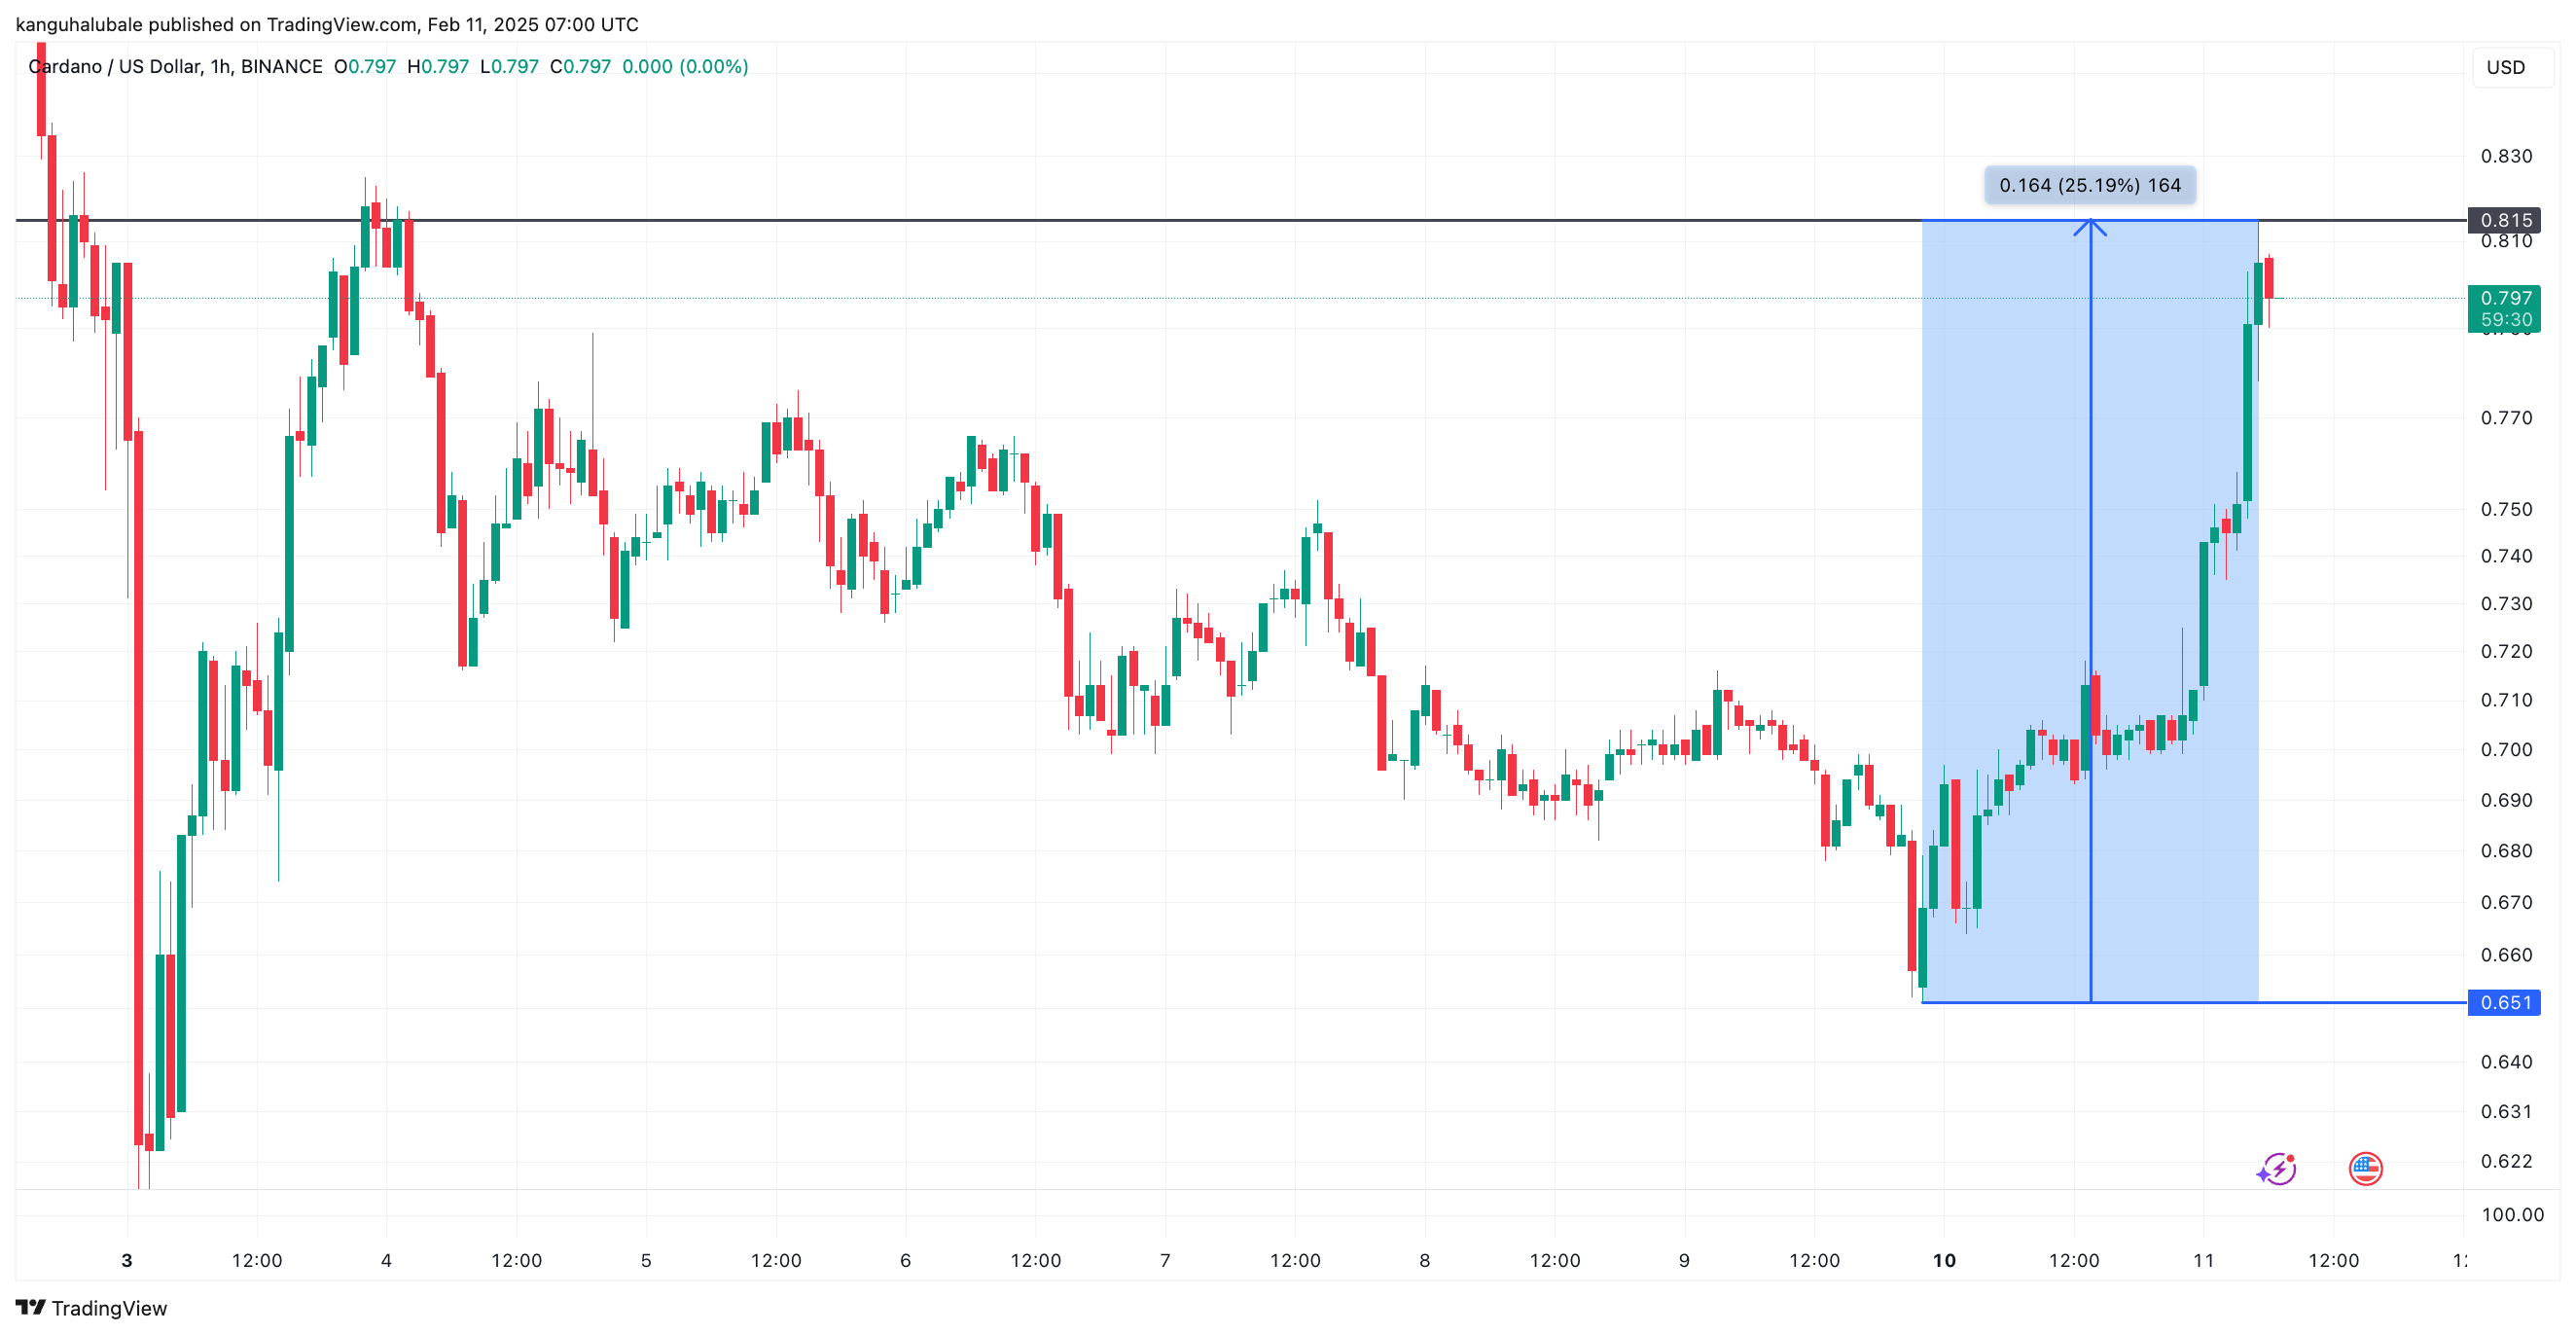
Cardano has recovered strongly, bouncing 25% since its $0.651 low on Feb. 10. The rebound comes after establishing support just above its 200-day simple moving average (SMA), possibly triggering its next leg higher.
At the time of writing, ADA’s price is trading at $0.797, up 15% over the last 24 hours. Its daily trading volume has jumped by over 60% to $1.25 billion, amplifying the buy pressure.
There are several factors driving the ADA price up today, including:
- Grayscale’s application for a spot Cardano ETF.
- The wipeout of overleveraged short positions in the ADA Futures market.
- ADA’s classic technical pattern projects a rally above $3.50.
ADA leads crypto gains following Grayscales ETF application
ADA price rallied on Feb. 11, outperforming the broader crypto market, after Grayscale filed for a spot Cardano exchange-traded fund (ETF) in the United States.
Key points:
- Crypto asset manager Grayscale filed for a Cardano ETF with the New York Stock Exchange on Monday, Feb. 10.
- This expands Grayscale’s ETF offerings after recentLitecoinLTC$126.82, XRPXRP$2.48, and SolanaSOL$202.44applications.
- A spot ETF would allow investors to gain exposure to ADA without the need to directly purchase and store the altcoin.
- This will potentially attract a wave of new institutional and retail investors.
- This application signals that major financial players see long-term value in Cardano.
- Approving an ETF could lend more legitimacy to ADA and increase liquidity.
ADA price jumped on the news, leading all the other top-cap cryptocurrencies in a much-needed recovery.
- Bitcoin, the largest cryptocurrency by market capitalization, has jumped 1.2% over the last day to trade around $98,400 at the time of writing.
- EtherETH$2,696has rallied more than 3% over the last 24 hours to trade just above $2,700.
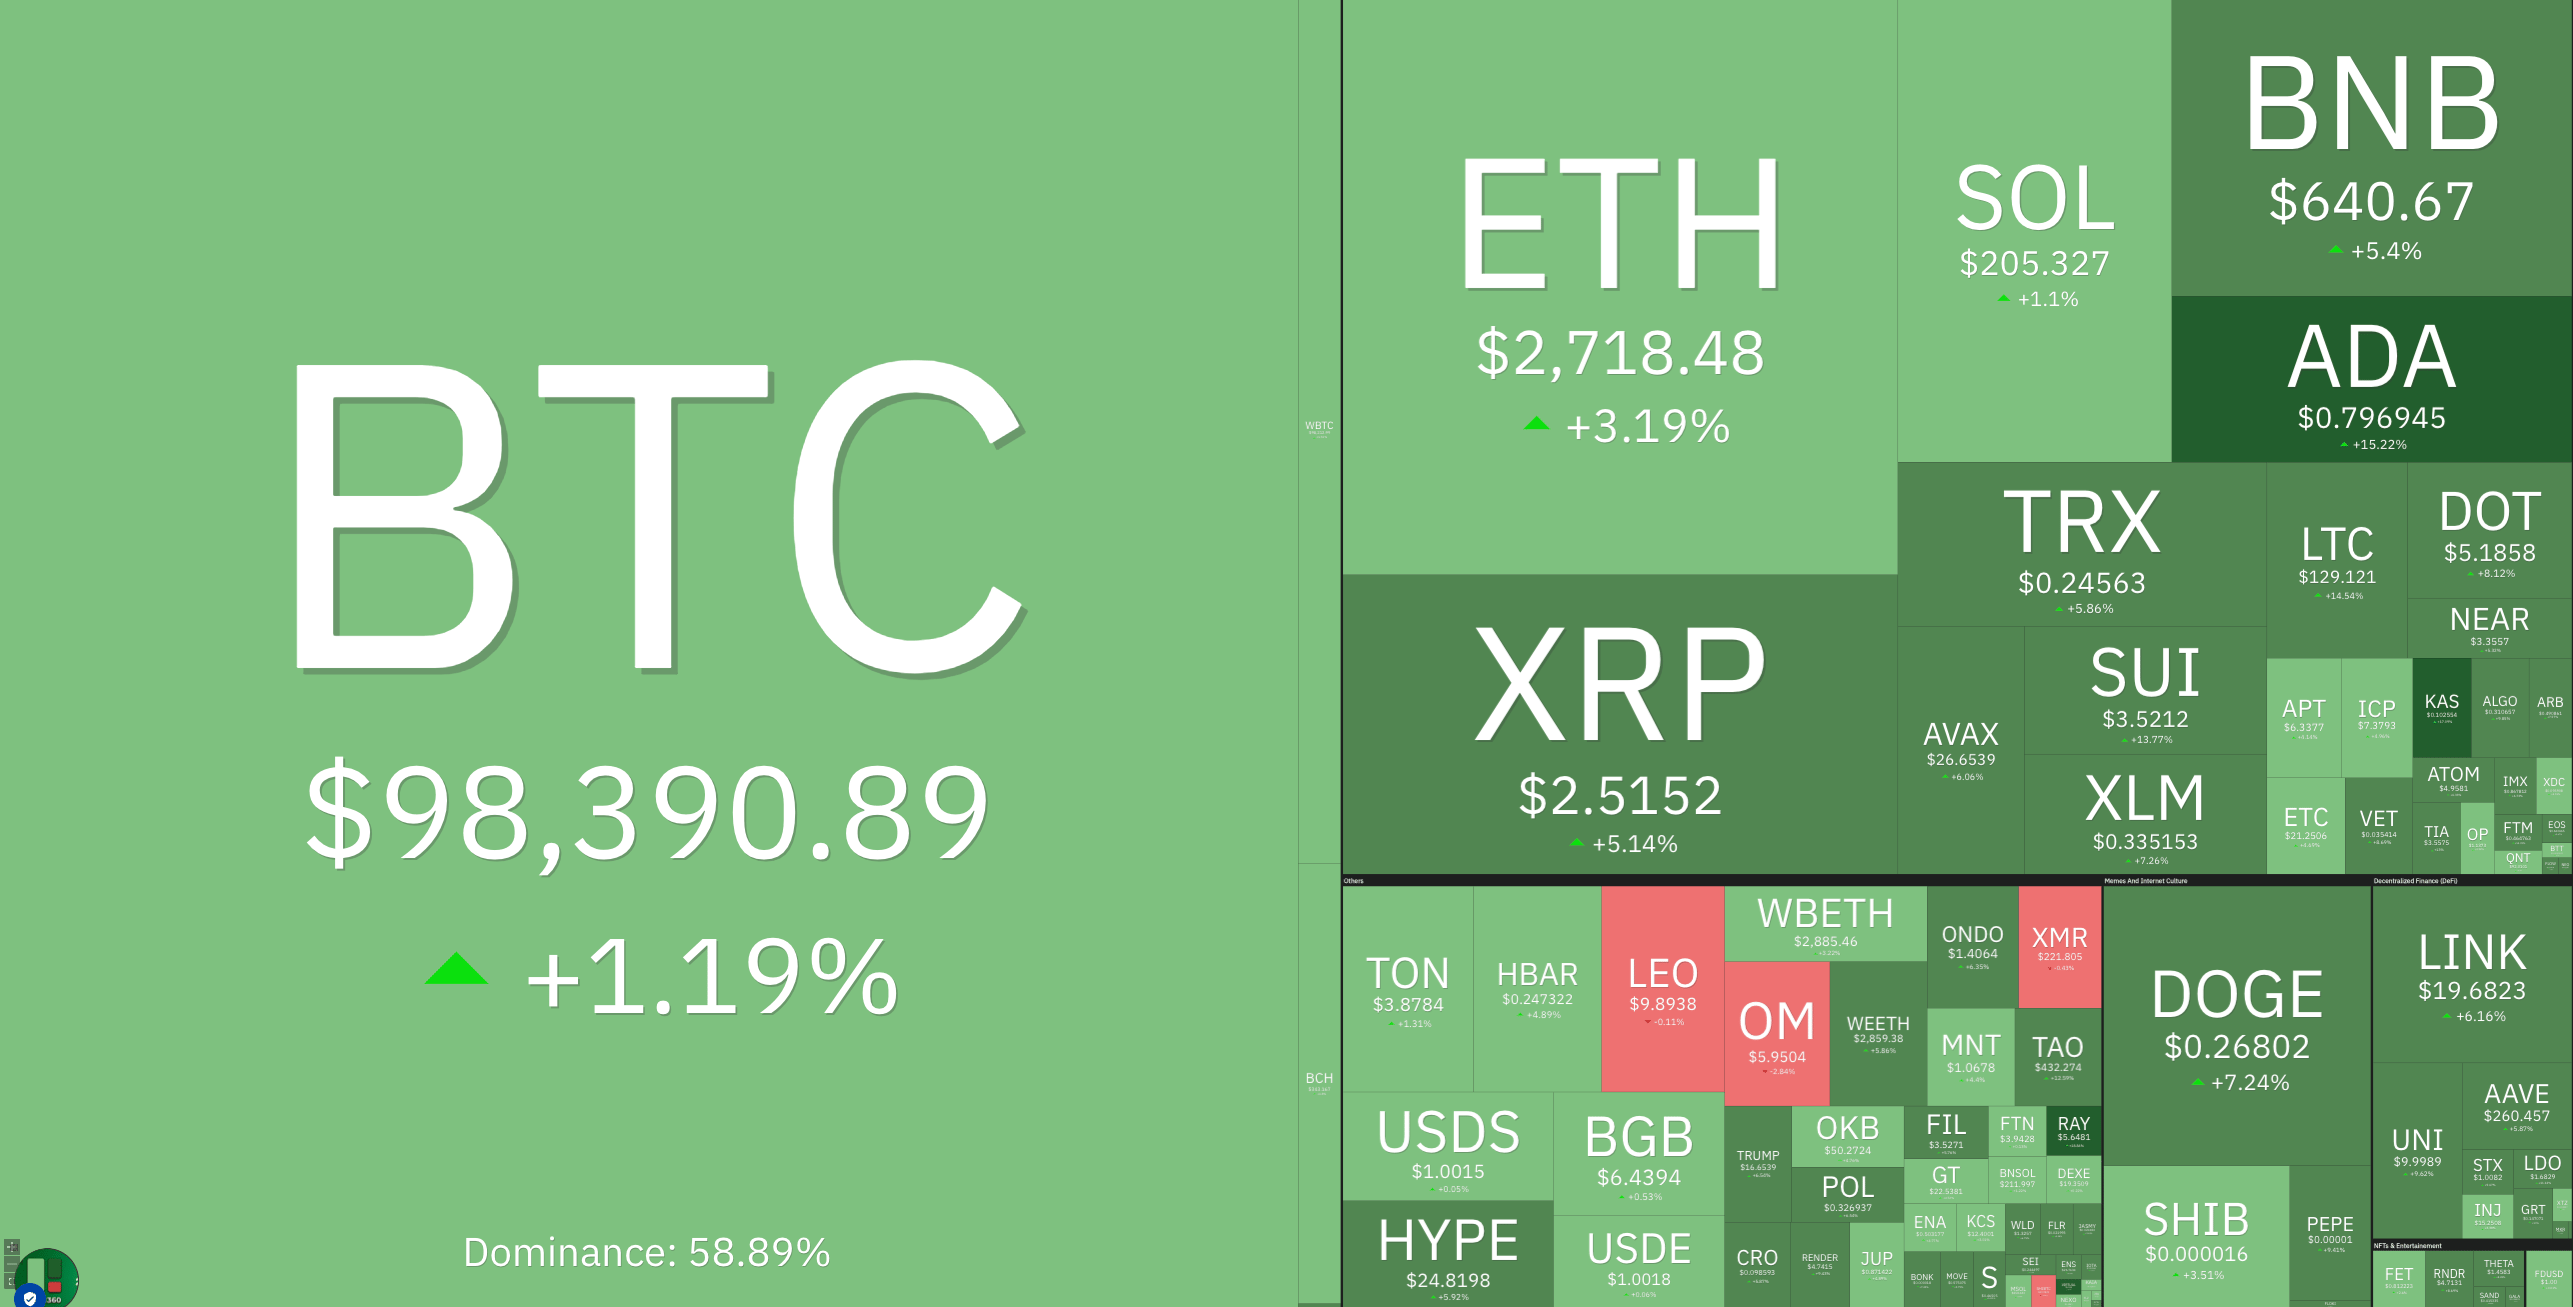
- Other top-cap cryptocurrencies, including BNB Chain’sBNB$638.94, XRP, and DogecoinDOGE$0.2647, have also posted significant gains on the day.
- The total crypto market cap has increased by 2.2% over the last 24 hours to rest at $3.24 trillion on Jan. 28.
Over $1.78M in ADA short positions liquidated
ADA’s price rally has triggered significant liquidations in the derivatives market, signaling strong bullish pressure.
Key points:
- Over $1.76 million worth of short ADA positions were liquidated on Feb. 11, compared to just $498,930 in long liquidations.
- Bearish traders are forced to sell their positions when short positions are liquidated.
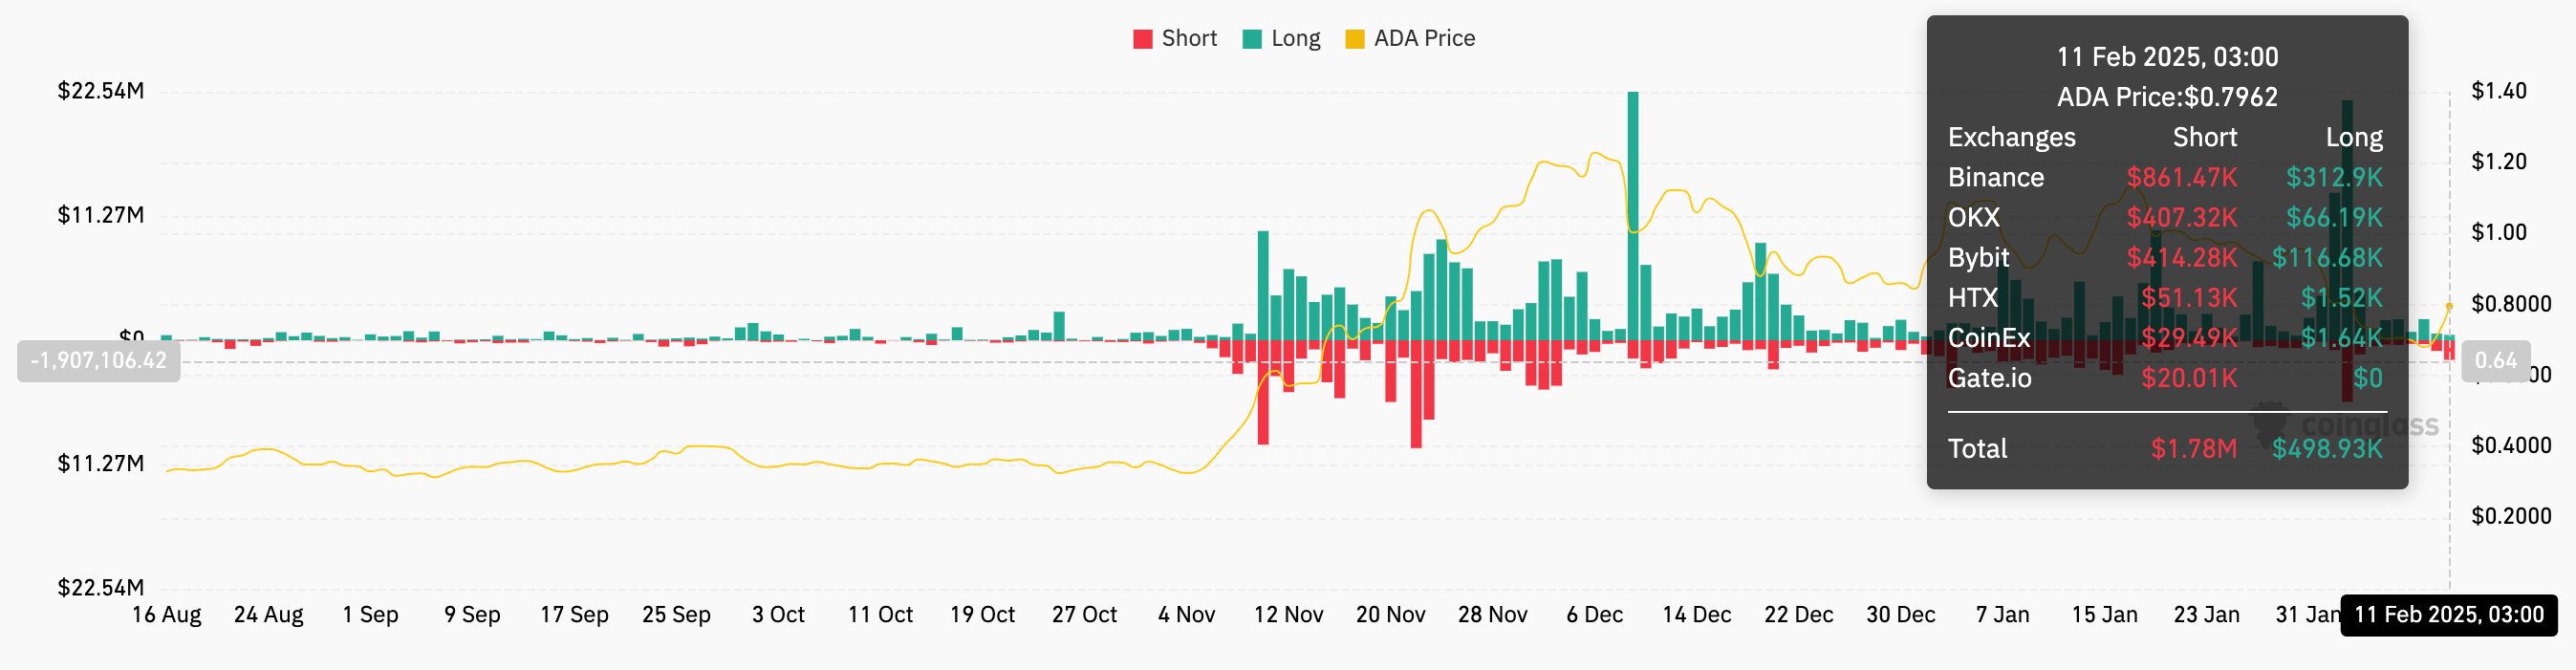
- ADA price rebounded due to the cascading liquidation effect.
- The scale of these liquidations mirrors the period between Jan. 1 and Jan. 3, when $7.6 million in short ADA positions were wiped out, accompanying a 33% price uptick to $1.12.
Related: Swedish digital asset manager launches Avalanche, Cardano ETP on Nasdaq Helsinki
ADA bull flag targets $3.57
The ADA/USD pair is expected to resume its prevailing bullish momentum despite the recent drop to $0.51 as it paints a classic technical structure with an upside outlook.
Key takeaways:
- ADA price action has a bull flag pattern on the weekly chart, indicating the possibility of regaining bullish momentum if key support levels hold.
- The bull flag developed following ADA’s rally from $0.33 in early November 2024 to a three-year high of $1.32 on Dec. 3, 2024, confirming a larger symmetrical triangle breakout.
- ADA is currently marching toward the upper boundary of the flag at $0.90. A break above this level could trigger another rally.
- The bull flag’s upside target for February, derived from the height of the previous rally, is approximately $3.57, representing almost 300% gains from the current level.
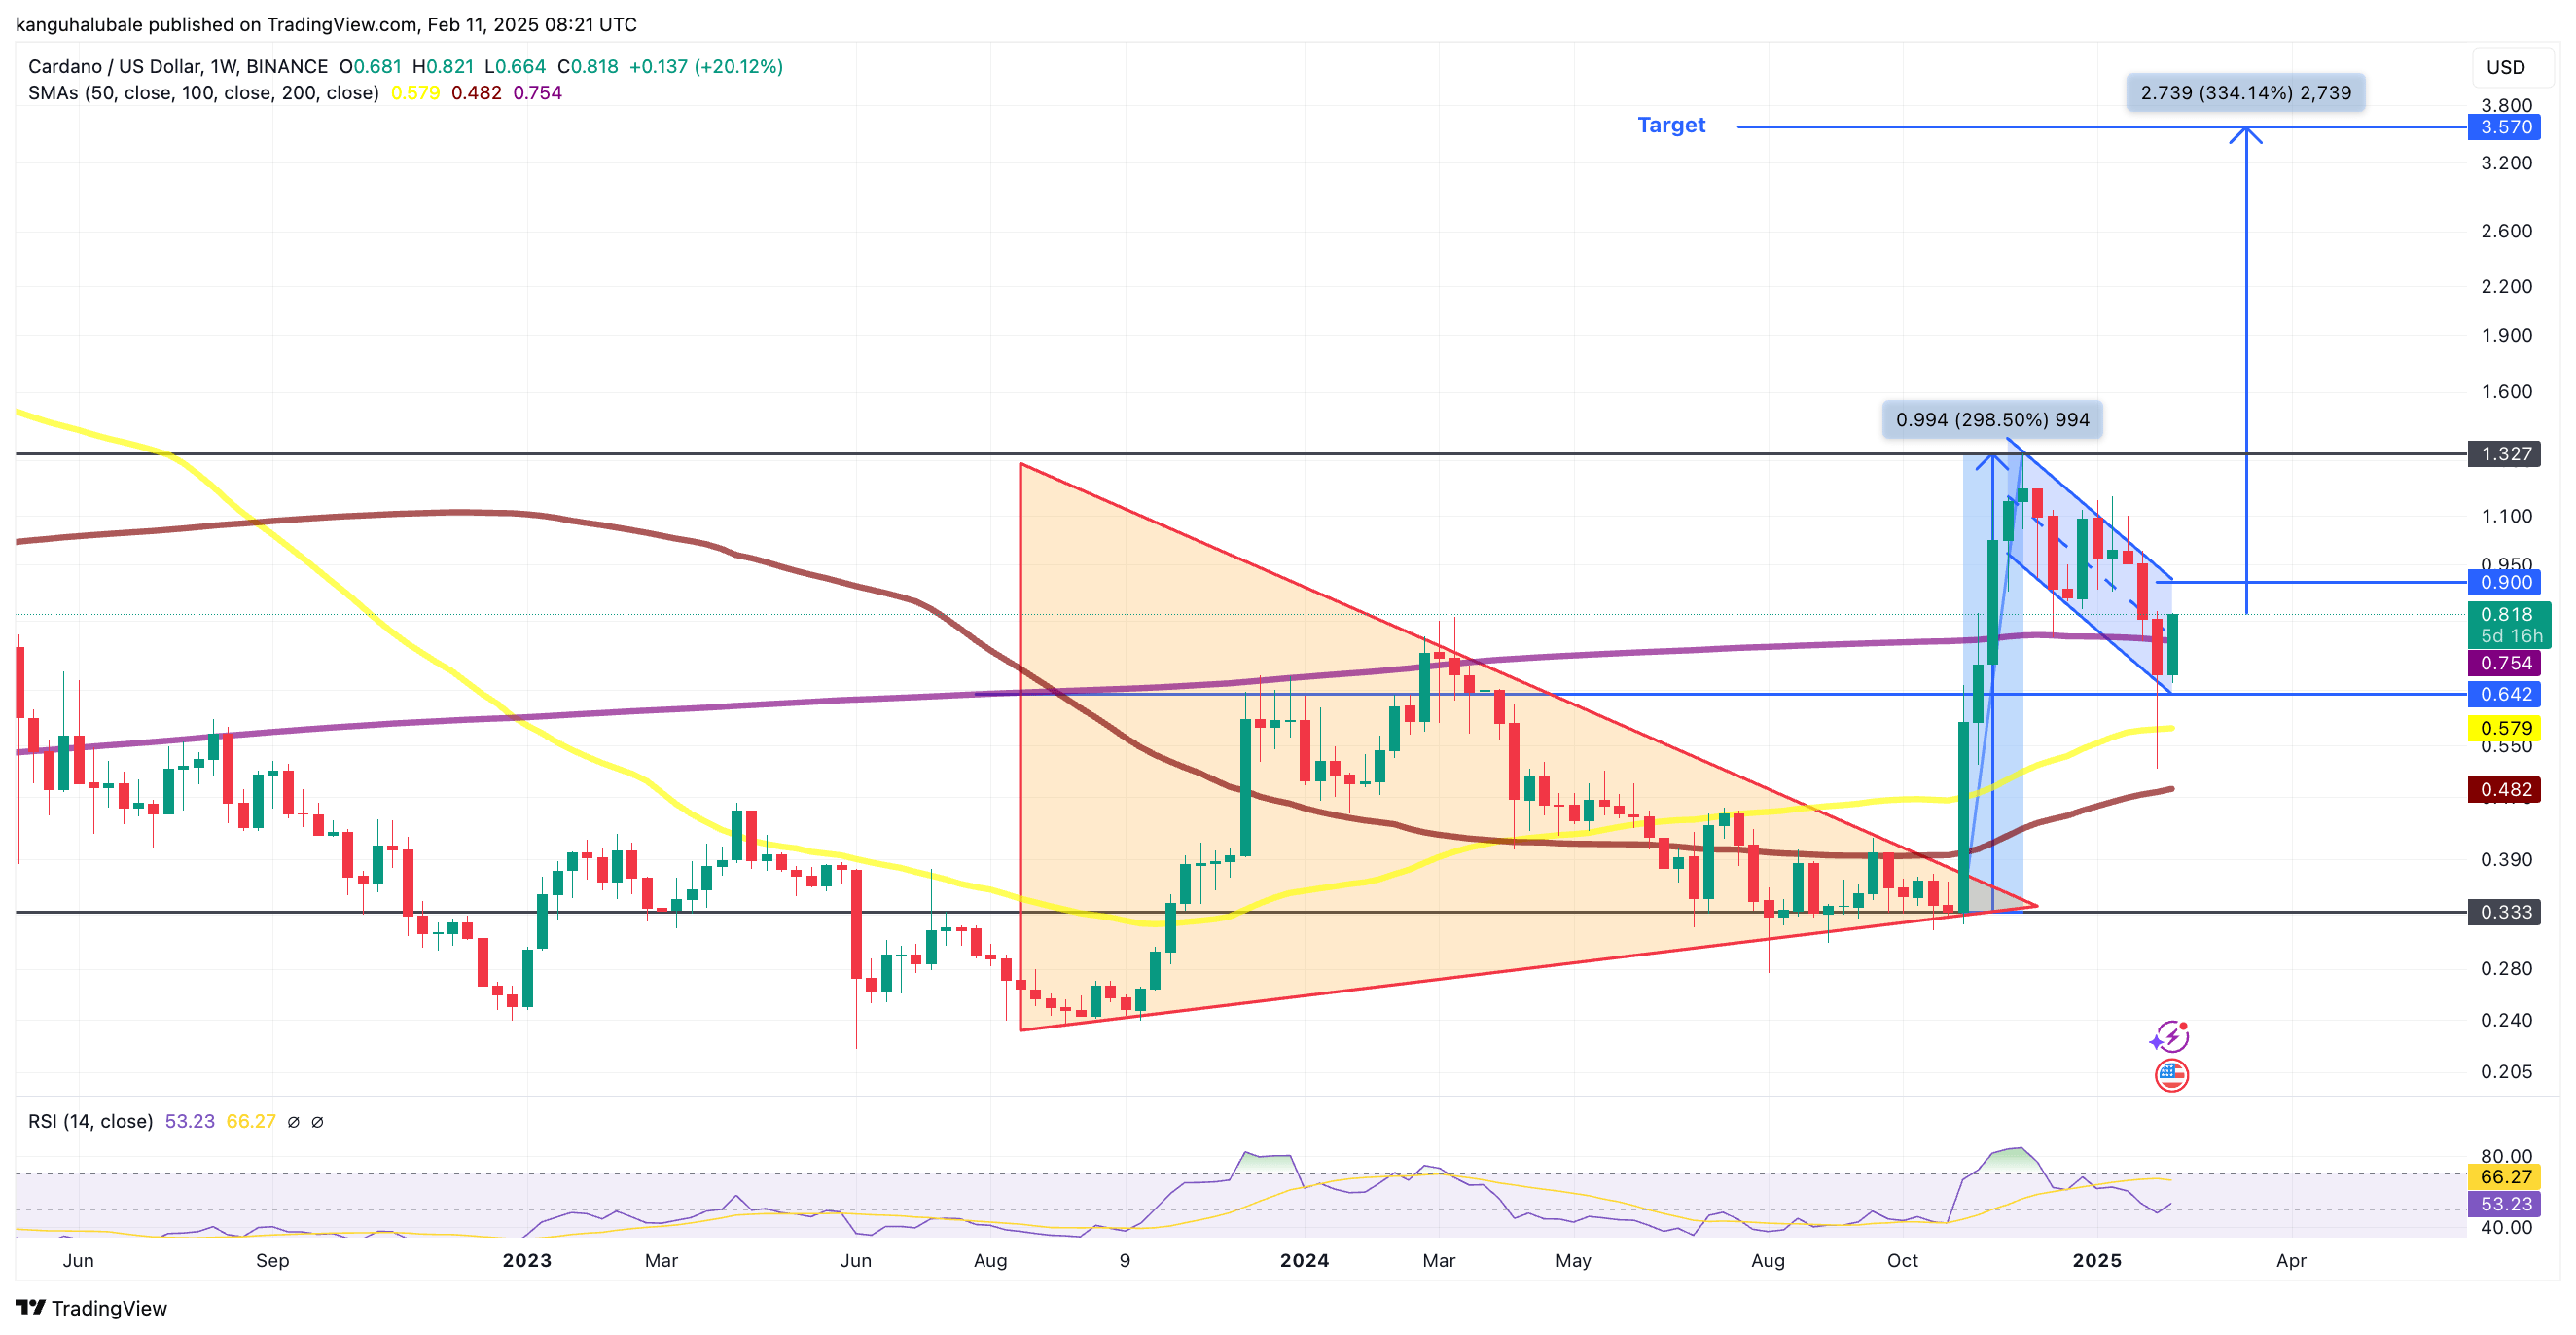
- The relative strength index (RSI) is above the midline and has risen from 47 to 52 over the last seven days, indicating an increasing bullish momentum.

All Comments