

Cointime

Download App
iOS & Android

ETH valuation metric hits level not seen since 2022: Is rally to $2.5K next?

Ether may be on the path to retesting $2,500 if the current rally above $2,150 and the bullish spot and futures market volumes pushing prices higher are sustained.

Ether is also supported by a key macro indicator that places the altcoin in a rare undervaluation zone not seen since 2022. The data points to fading selling pressure and the early stages of an accumulation process for Ether.

ETH price structure strengthens above $2,150

Ether’s daily chart shows bulls leading the charge after a 6.33% rally pushed the price above the $2,150 resistance. ETH now eyes a retest of its March highs near $2,385, with further upside toward the $2,475–$2,635 fair-value gap acting as a price magnet for bulls.

Repeat retests of $2,150 over the past two months suggest weakening resistance, as buyers continue stepping in at higher levels.
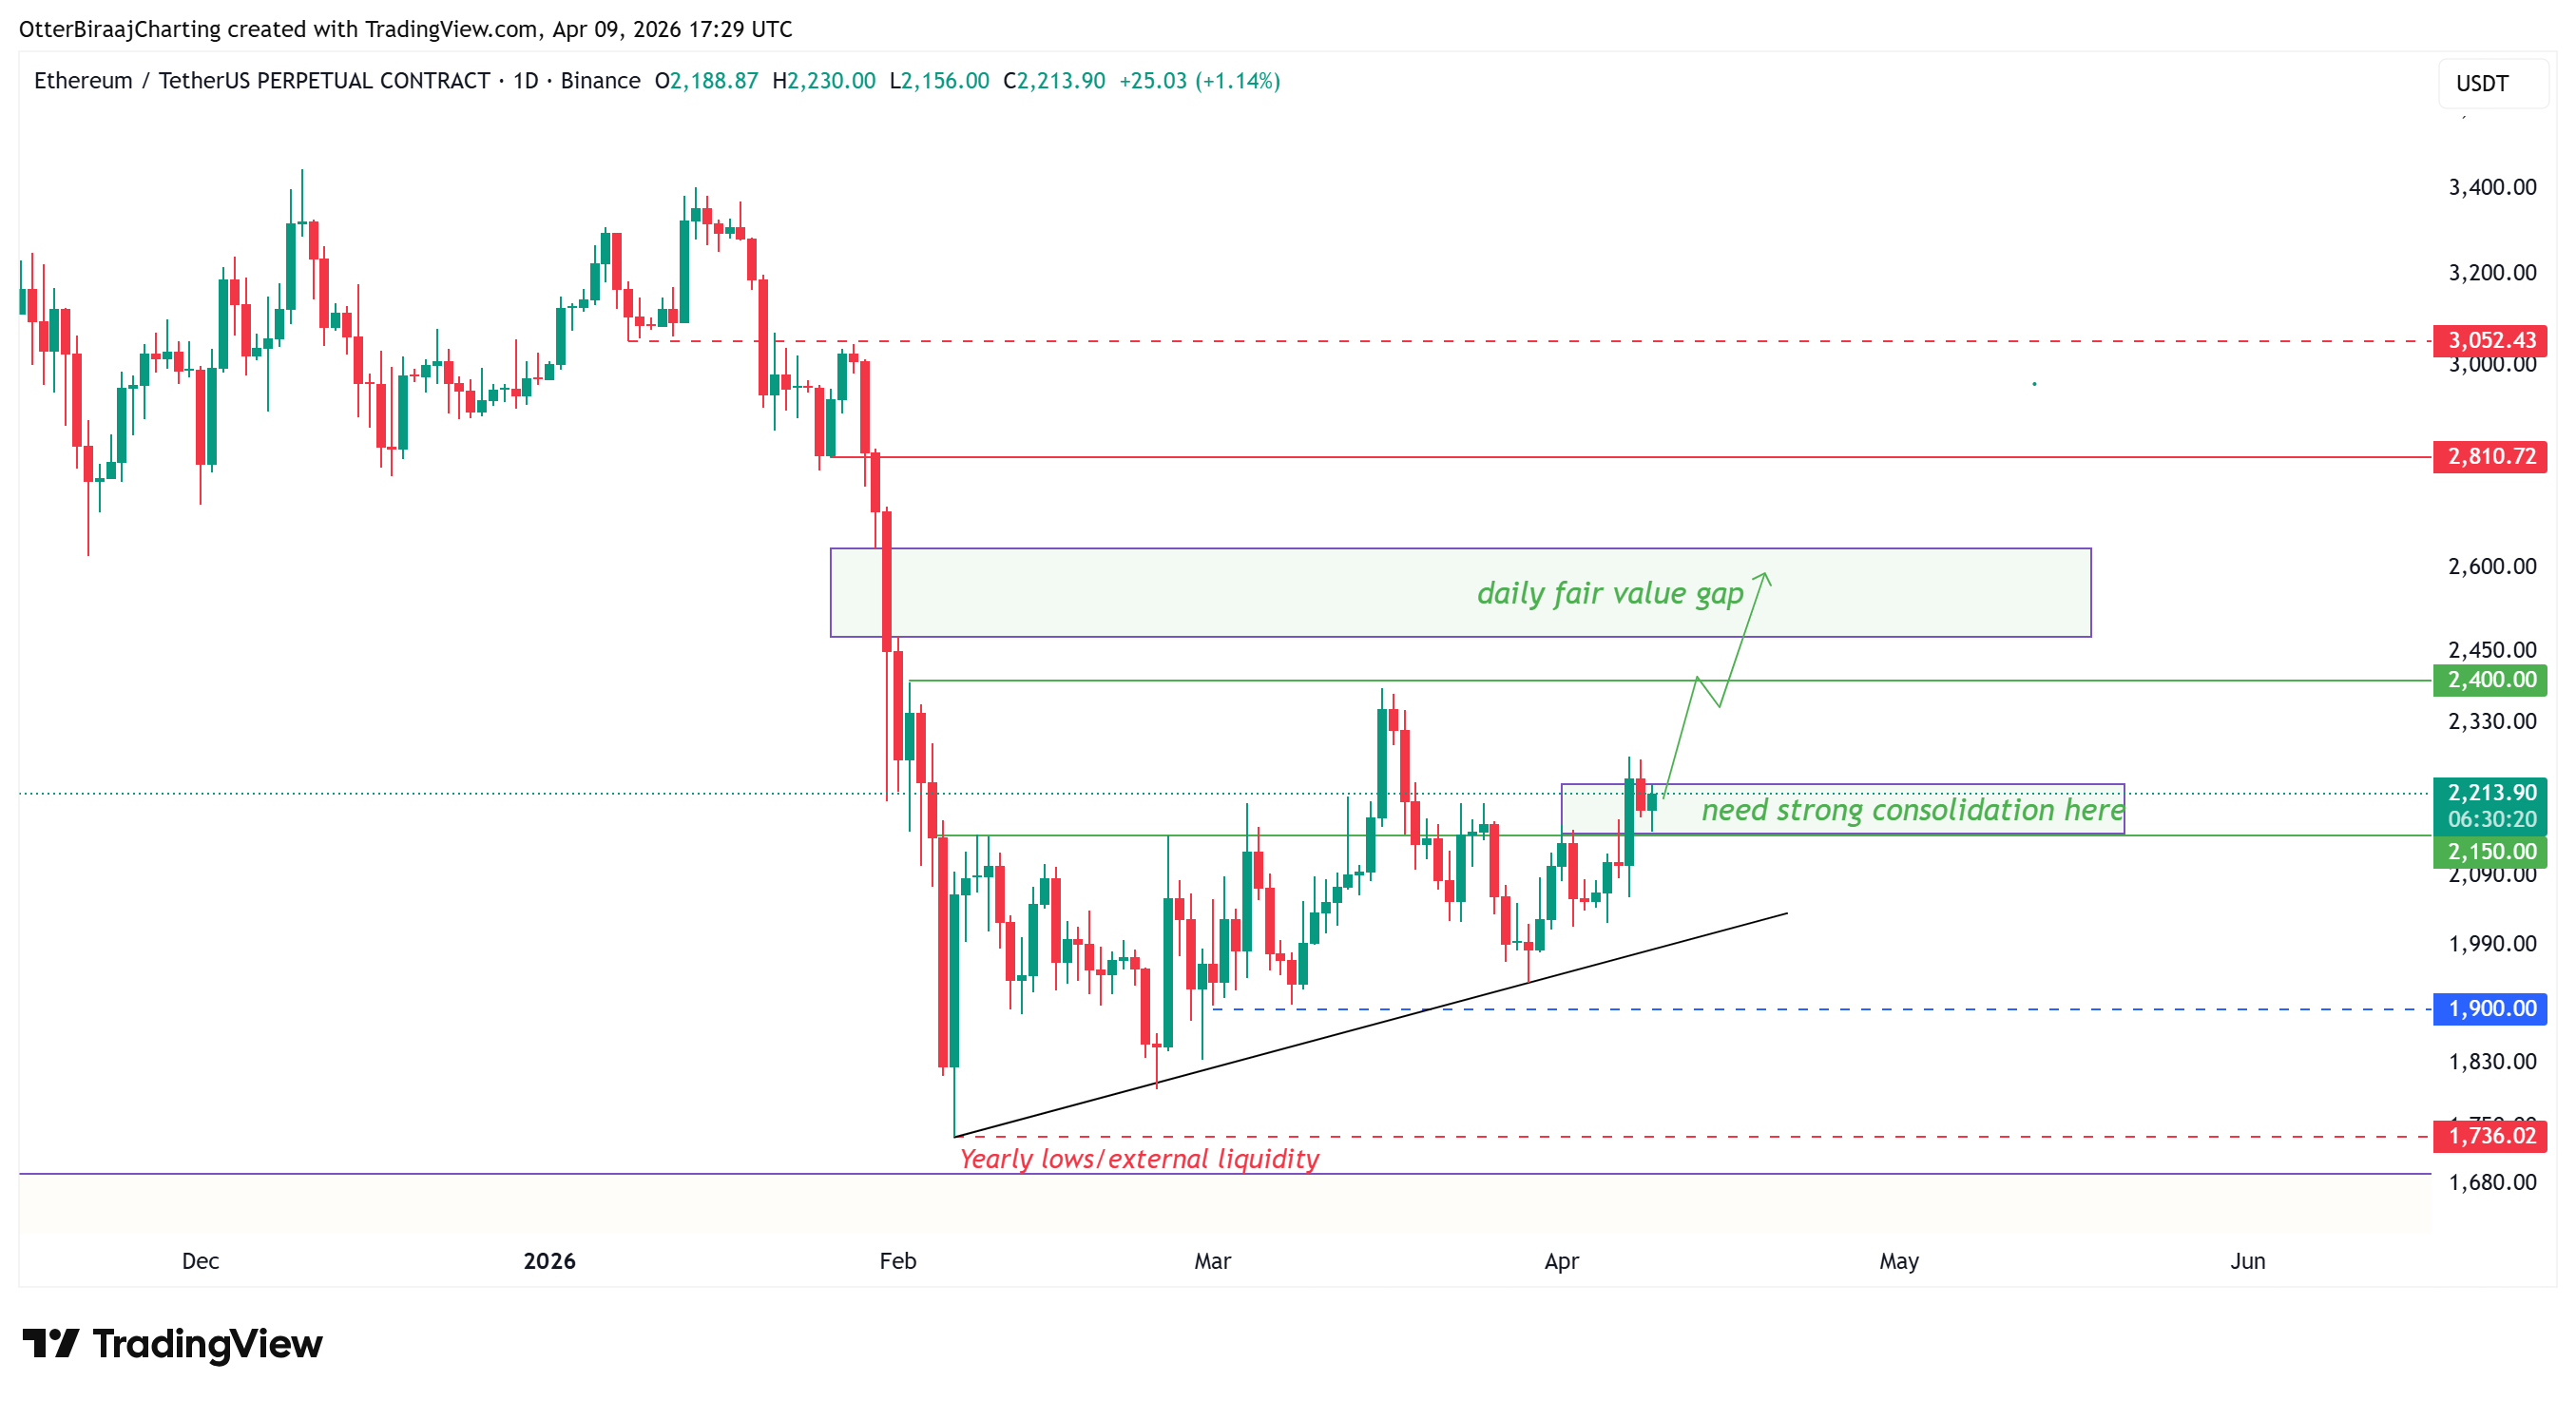
ETH/USDT on the one-day chart. Source: Cointelegraph/TradingView


Charts show ETH market structure improving and the current volumes being largely spot market driven. On the four-hour chart, ETH maintains higher lows while attempting to break into the $2,250–$2,300 range.

The aggregated spot cumulative volume delta (CVD) has remained elevated in April at 184,500 ETH, reflecting sustained spot demand.
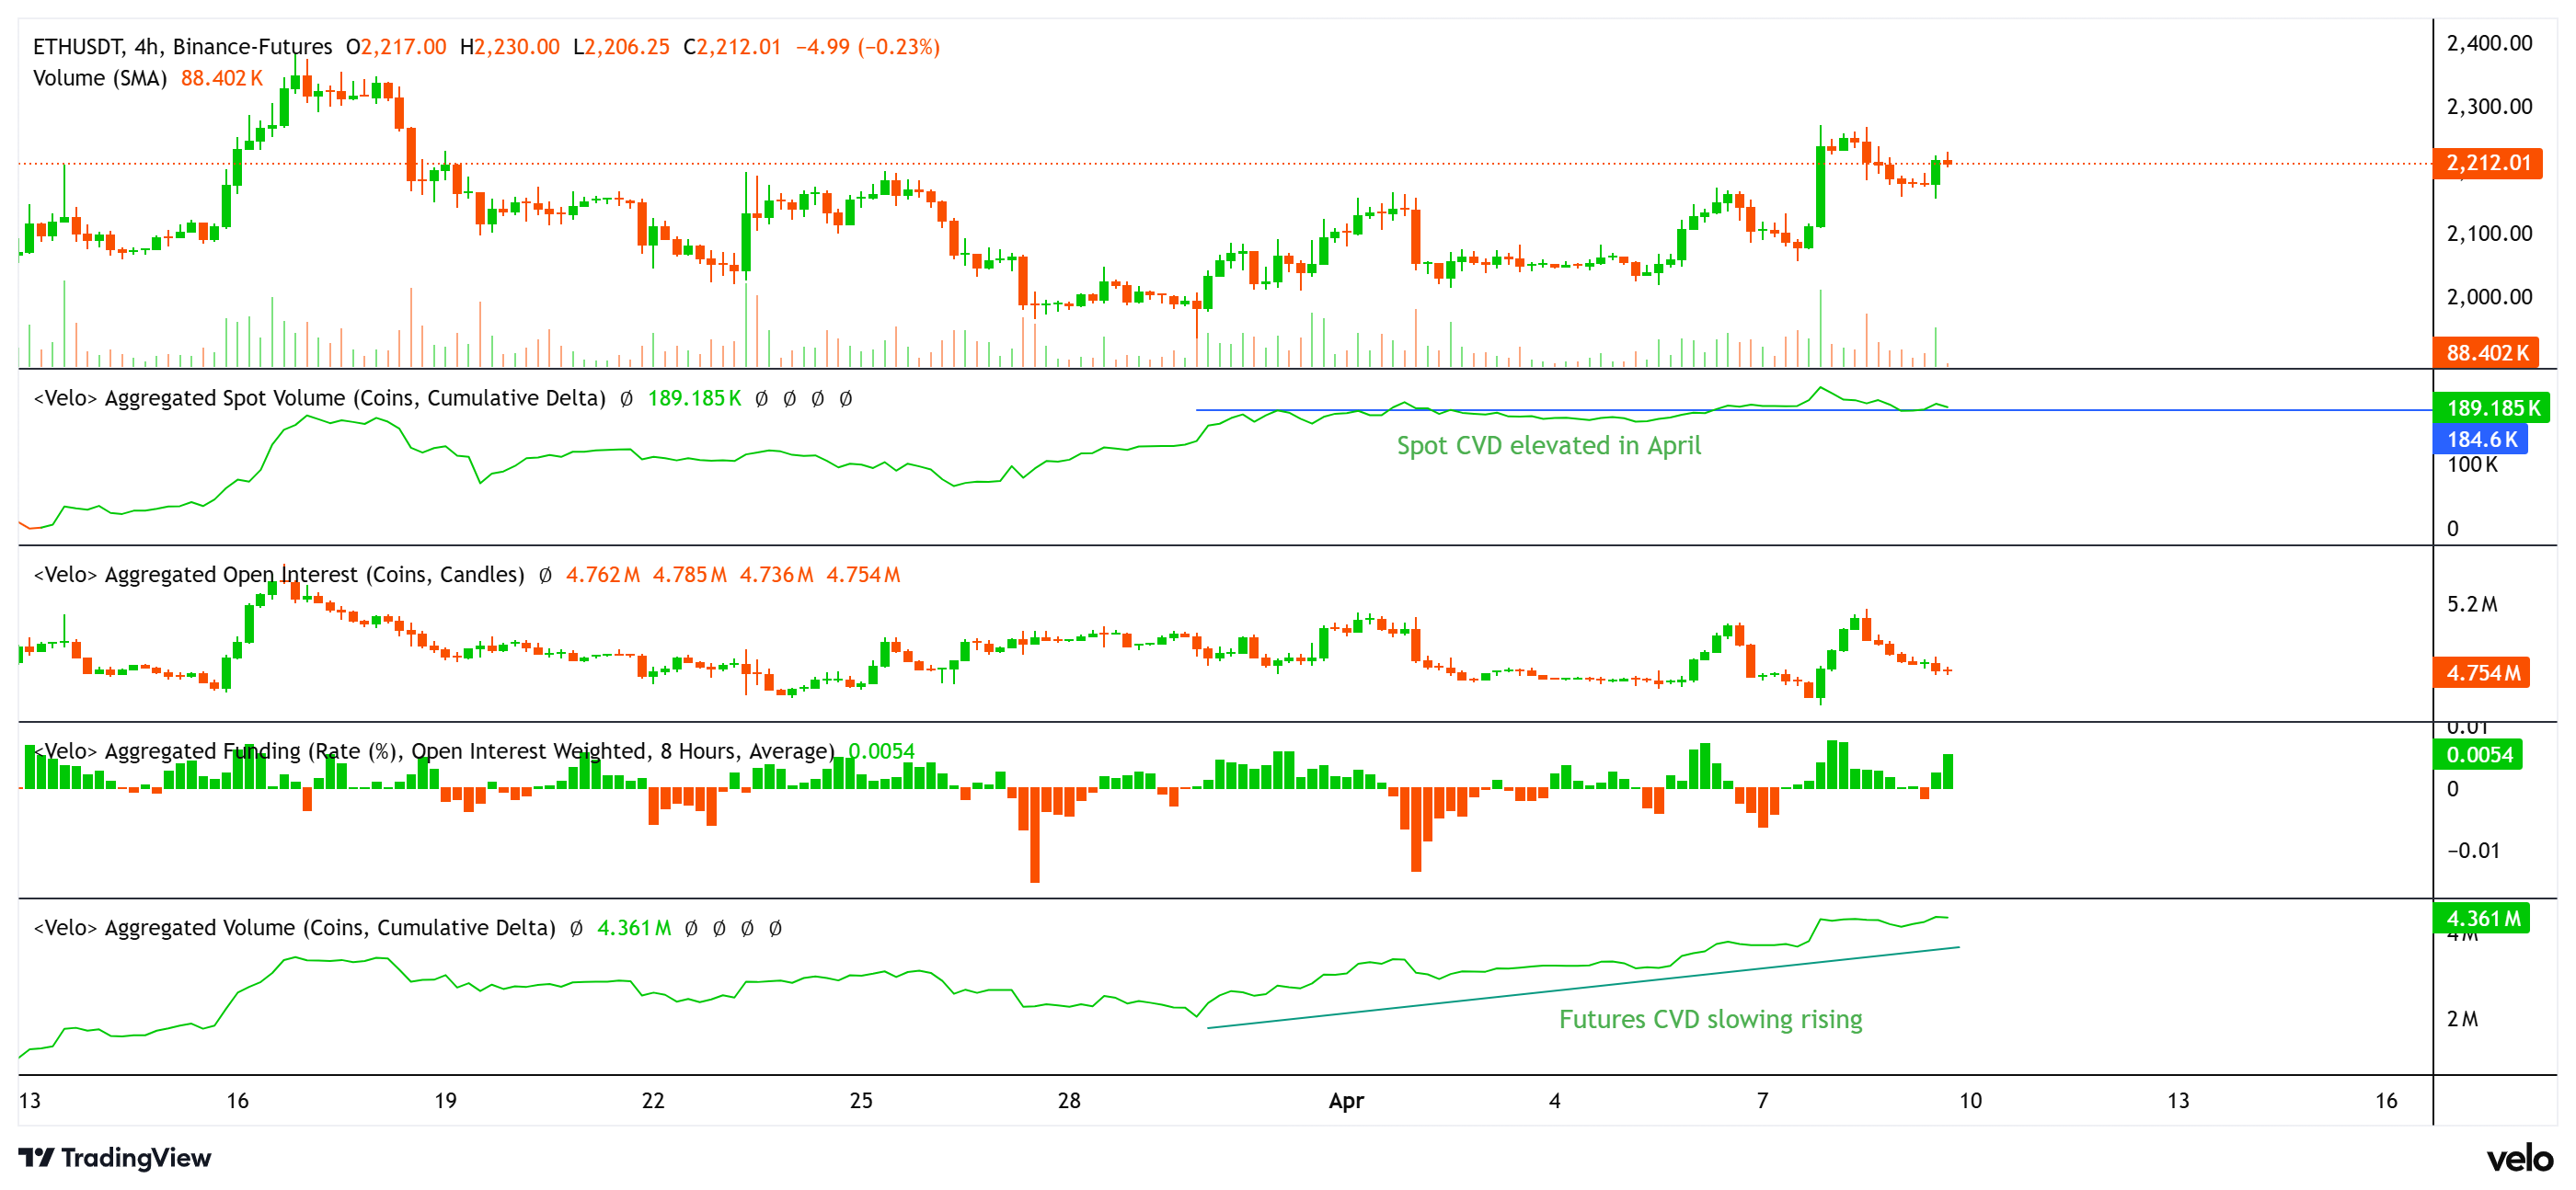
ETH spot CVD, futures CVD, open interest and funding rate. Source: Velo.chart


The futures CVD has also trended gradually upward to 4.36 million ETH, suggesting that derivatives traders are beginning to support, rather than lead, the move.

The funding rate remains positive at 0.0052, indicating a long bias, and the open interest near 4.75 million ETH is still range-bound, signaling limited leverage.

Data shows ETH is in a controlled accumulation phase, marginally led by spot demand, though a stronger breakout would likely require an expansion in futures positioning.

Macro index shows ETH in a “rare” undervalued zone

Ether may be nearing a macro bottom according to the Capriole Macro Index Oscillator with a reading at -2.42. This puts Ether in a rare undervalued zone historically linked with capitulation and trend reversals.

The indicator tracks investment behavior, cycle positioning, and onchain data, with deeply negative values often signaling seller exhaustion.

Previous signals highlight the metric’s reliability. In June to July 2022, ETH bottomed near $1,000–$1,200 when the indicator fell to -2.2. In October to November 2023, a drop to -1 aligned with ETH’s price breaking out after a drop to $1,500.

In April 2025, another negative reading marked a local bottom near $1,500, setting the stage for a rally above $4,000.
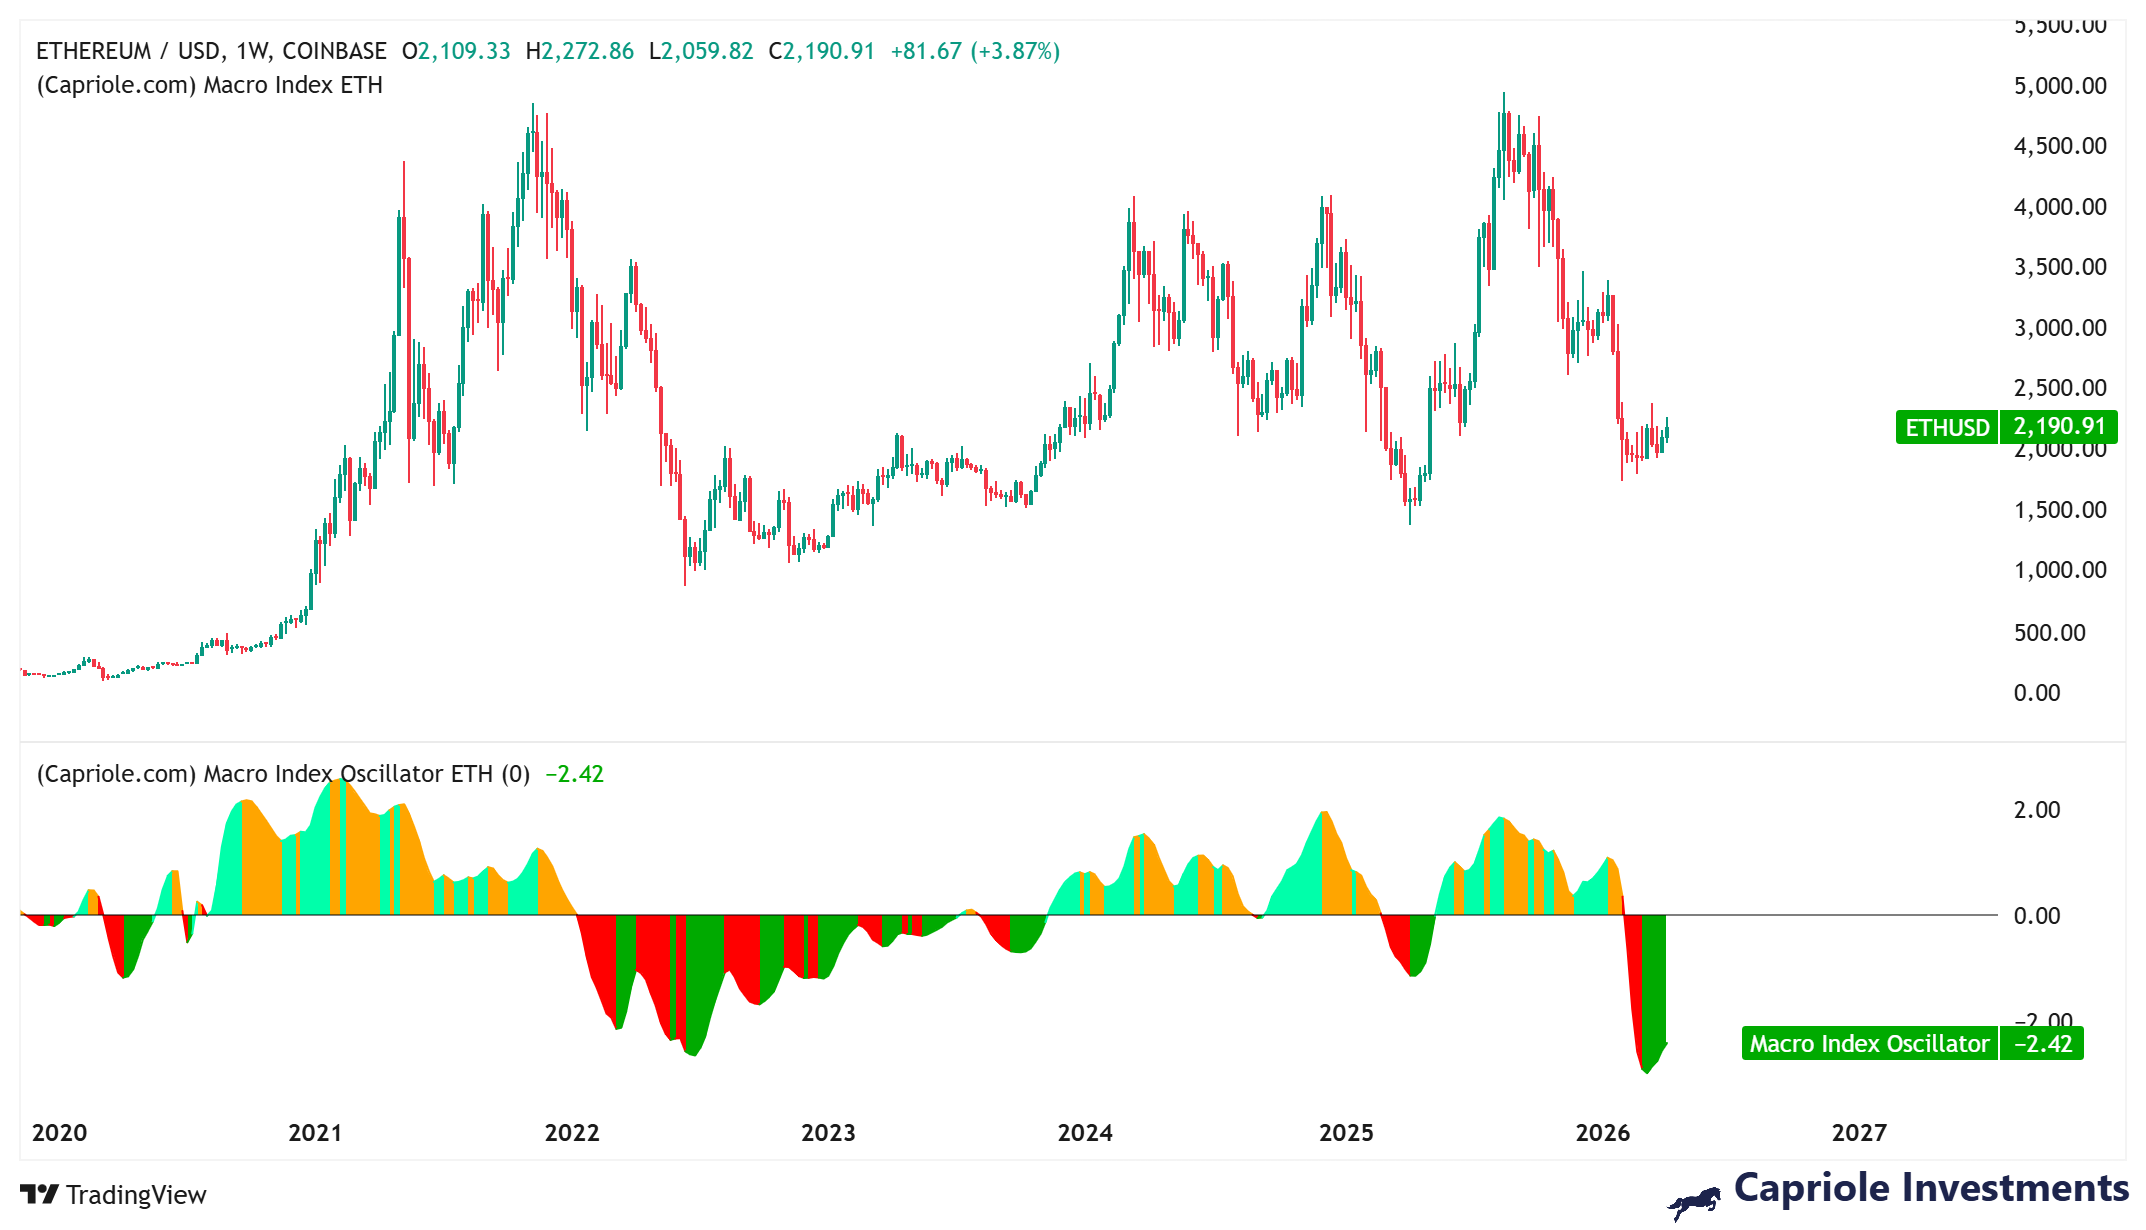
Macro Index Oscillator for ETH. Source: Capriole Investments


The current setup mirrors prior capitulation phases. ETH has fallen from highs near $4,800 to $2,100, while the oscillator sits near cycle lows.

With ETH now in a rare undervalued zone, the downside risk appears limited relative to the upside potential. However, the confirmation would come with a reclaim of the $2,400–$2,500 level and a move back toward zero for the macro indicator.

Analyst crypto sunmoon noted that the ETH taker buy/sell ratio has been trending upward for four to five months.

Combined with the current drawdown, the structure resembles the setup preceding the April to May 2025 rally, suggesting a similar recovery phase may be forming.
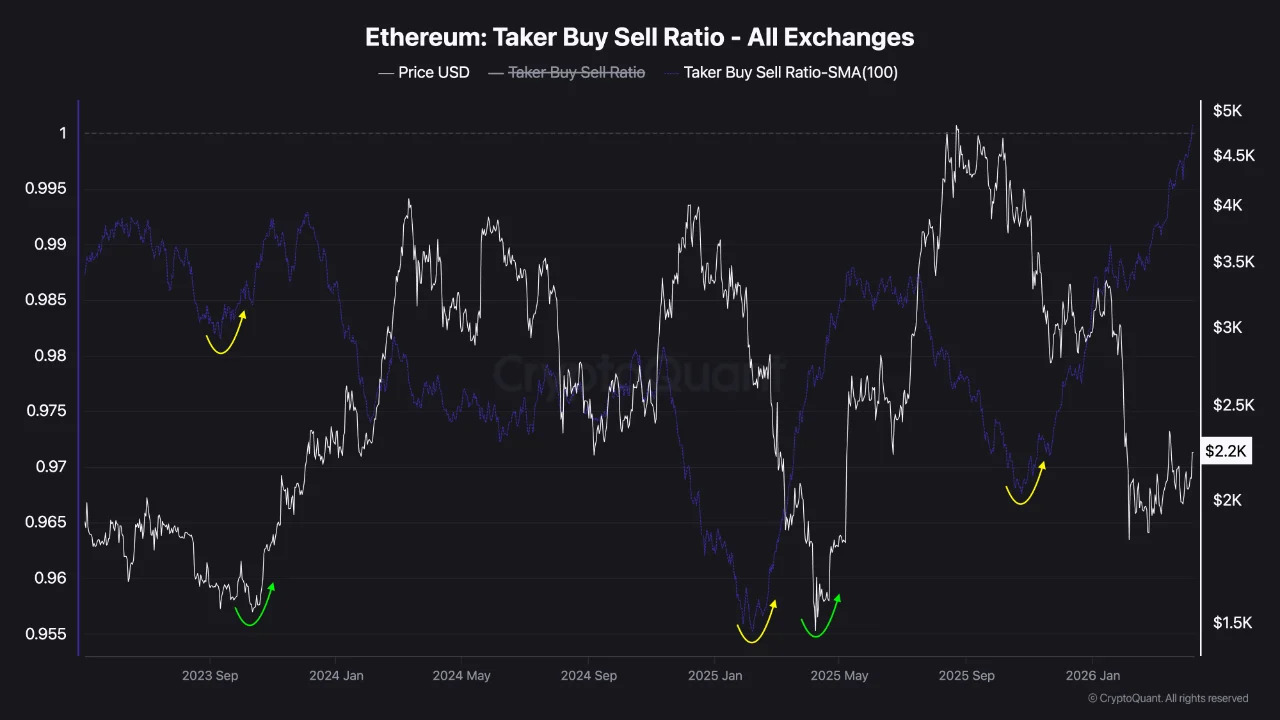

Ether taker buy-sell ratio on all exchanges. Source: CryptoQuant


Comments

All Comments

Recommended for you

  • Trump Shares Op-Ed Claiming He is Winning the War Against Iran

    On August 29, U.S. President Trump shared a commentary article from the New York Post on Truth Social on Saturday, which stated that he is winning the war against Iran and should maintain the current strategy. The title of the article Trump shared read: 'Trump is Winning the War Against Iran - Stay the Course.'

  • Morgan Stanley: 2028 as a Key Observation Point for Global Memory Competition Landscape

    On August 29, Morgan Stanley pointed out that the rise of Chinese memory manufacturers should not be viewed merely as a technological catch-up or low-cost substitution; what is truly noteworthy is that their production capacity may gradually become large enough to alter the supply structure of the global memory market. Changxin Technology and Yangtze Memory Technologies are currently entering the mainstream product market and gradually extending into high-profit markets such as HBM, high-end server DRAM, and enterprise SSDs. Morgan Stanley considers 2028 as an important observation point for the global memory competition landscape. From 2026 to 2027, demand for AI servers, capacity crowding of advanced wafers by HBM, import substitution, and the time required for customer certification may absorb most of the new supply from Chinese memory manufacturers. By 2028, as Chinese manufacturers expand production, the additional capacity from Samsung, SK Hynix, and Micron, which had previously initiated expansions, will also be released. At that time, the supply variables in the global memory market will significantly increase. Morgan Stanley estimates that Changxin's DRAM monthly production capacity will rise from 180,000 wafers in 2025 to 300,000 in 2026, accounting for approximately 13% of global DRAM wafer capacity and about 11% of bit shipments; by 2028, it is expected to further increase to 500,000 wafers, and by 2031, it could reach 800,000 wafers. If the expansion proceeds smoothly, Changxin's global DRAM bit shipment market share could approach 15% by 2030, and it may even have the opportunity to surpass Micron in production capacity around 2028, becoming the third-largest DRAM supplier in the world.

  • US Spot Ethereum ETF Sees Net Inflow of $102.17 Million Yesterday

    On August 29, according to monitoring by Trader T, the US spot Ethereum ETF recorded a net inflow of $102.17 million yesterday.

  • US Spot Ethereum ETF Sees Net Inflow of $102.17 Million

    On August 29, according to monitoring by Trader T, the US spot Ethereum ETF experienced a net inflow of $102.17 million yesterday.

  • US Spot Bitcoin ETF Sees Net Outflow of $201.81 Million

    On August 29, according to monitoring by Trader T, the US spot Bitcoin ETF experienced a net outflow of $201.81 million yesterday.

  • US Spot Bitcoin ETF Sees Net Outflow of $201.81 Million Yesterday

    On August 29, according to monitoring by Trader T, the US spot Bitcoin ETF experienced a net outflow of $201.81 million yesterday.

  • BTC Surpasses $78,000

    Market data shows that BTC has surpassed $78,000, currently priced at $78,009.49. The 24-hour decline has narrowed to 3.23%. Due to significant market fluctuations, please ensure proper risk management.

  • BTC Surpasses $78,000

    Market data shows that BTC has surpassed $78,000, currently priced at $78,009.49, with a 24-hour decline narrowing to 3.23%. The market is experiencing significant volatility, so please ensure proper risk management.

  • BTC Briefly Drops Below $77,000

    Market data shows that BTC briefly fell below $77,000, currently reported at $77,694, with a 24-hour decline of 3.3%. The market is experiencing significant volatility, so please ensure proper risk management.
